Cypriot vs Yuman Hearing Disability
COMPARE
Cypriot
Yuman
Hearing Disability
Hearing Disability Comparison
Cypriots
Yuman
2.8%
HEARING DISABILITY
92.9/ 100
METRIC RATING
110th/ 347
METRIC RANK
3.4%
HEARING DISABILITY
0.4/ 100
METRIC RATING
250th/ 347
METRIC RANK
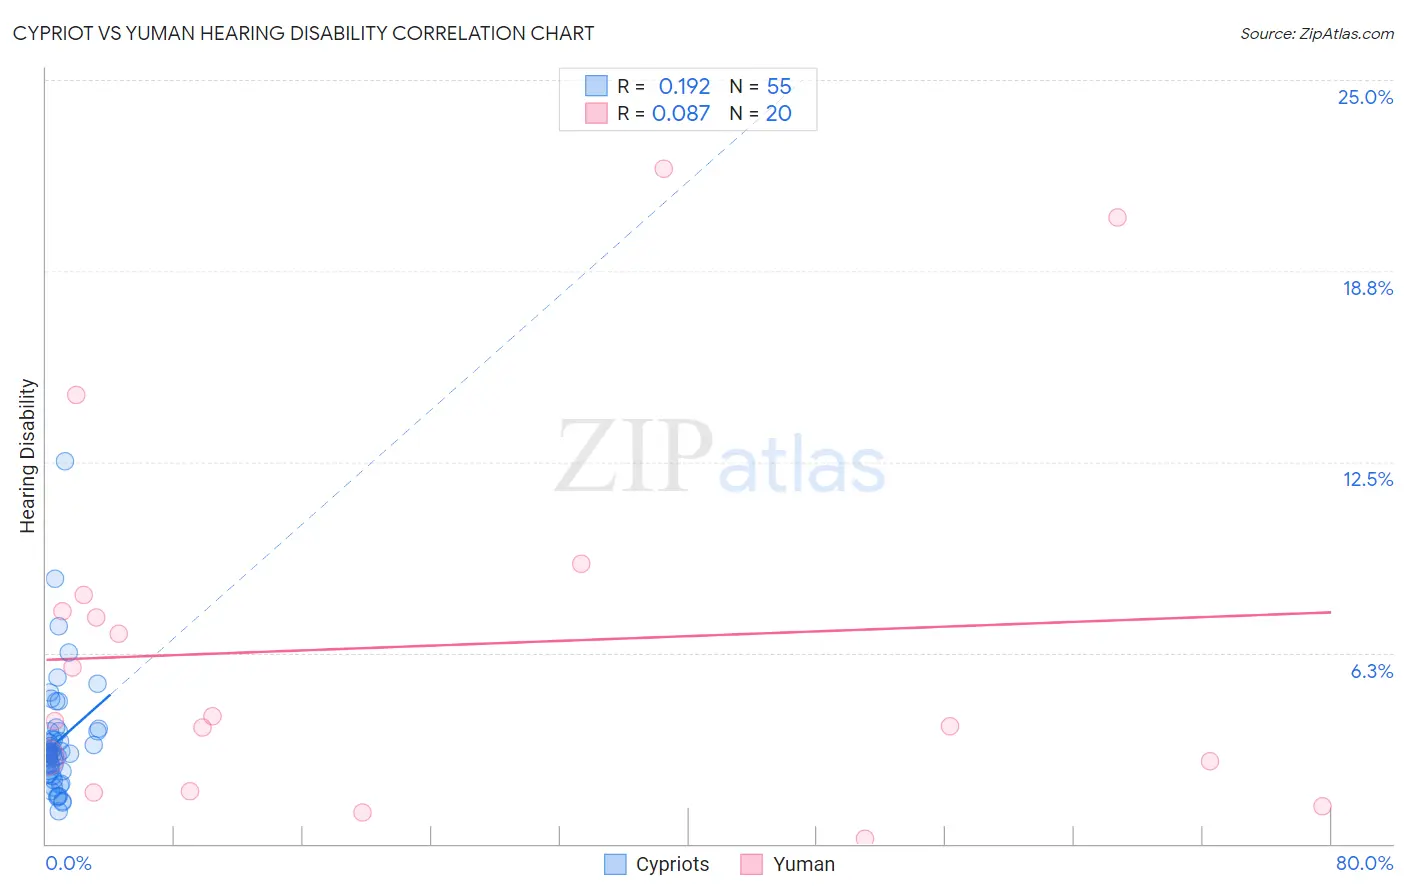
Cypriot vs Yuman Hearing Disability Correlation Chart
The statistical analysis conducted on geographies consisting of 61,868,814 people shows a poor positive correlation between the proportion of Cypriots and percentage of population with hearing disability in the United States with a correlation coefficient (R) of 0.192 and weighted average of 2.8%. Similarly, the statistical analysis conducted on geographies consisting of 40,662,882 people shows a slight positive correlation between the proportion of Yuman and percentage of population with hearing disability in the United States with a correlation coefficient (R) of 0.087 and weighted average of 3.4%, a difference of 20.0%.
Hearing Disability Correlation Summary
| Measurement | Cypriot | Yuman |
| Minimum | 1.1% | 0.16% |
| Maximum | 12.5% | 22.1% |
| Range | 11.4% | 22.0% |
| Mean | 3.3% | 6.5% |
| Median | 3.0% | 4.1% |
| Interquartile 25% (IQ1) | 2.4% | 2.2% |
| Interquartile 75% (IQ3) | 3.7% | 7.9% |
| Interquartile Range (IQR) | 1.3% | 5.7% |
| Standard Deviation (Sample) | 1.9% | 6.1% |
| Standard Deviation (Population) | 1.9% | 6.0% |
Similar Demographics by Hearing Disability
Demographics Similar to Cypriots by Hearing Disability
In terms of hearing disability, the demographic groups most similar to Cypriots are Turkish (2.8%, a difference of 0.050%), Immigrants from Yemen (2.8%, a difference of 0.050%), Guatemalan (2.8%, a difference of 0.12%), U.S. Virgin Islander (2.8%, a difference of 0.12%), and Honduran (2.8%, a difference of 0.20%).
| Demographics | Rating | Rank | Hearing Disability |
| Immigrants | Indonesia | 94.7 /100 | #103 | Exceptional 2.8% |
| Burmese | 94.2 /100 | #104 | Exceptional 2.8% |
| Moroccans | 93.9 /100 | #105 | Exceptional 2.8% |
| Hondurans | 93.4 /100 | #106 | Exceptional 2.8% |
| Immigrants | Chile | 93.4 /100 | #107 | Exceptional 2.8% |
| Guatemalans | 93.2 /100 | #108 | Exceptional 2.8% |
| Turks | 93.0 /100 | #109 | Exceptional 2.8% |
| Cypriots | 92.9 /100 | #110 | Exceptional 2.8% |
| Immigrants | Yemen | 92.7 /100 | #111 | Exceptional 2.8% |
| U.S. Virgin Islanders | 92.5 /100 | #112 | Exceptional 2.8% |
| Immigrants | Belarus | 91.6 /100 | #113 | Exceptional 2.8% |
| Cambodians | 91.1 /100 | #114 | Exceptional 2.8% |
| Immigrants | Latin America | 90.5 /100 | #115 | Exceptional 2.8% |
| Immigrants | Immigrants | 90.3 /100 | #116 | Exceptional 2.8% |
| Immigrants | Liberia | 90.0 /100 | #117 | Excellent 2.8% |
Demographics Similar to Yuman by Hearing Disability
In terms of hearing disability, the demographic groups most similar to Yuman are Italian (3.4%, a difference of 0.010%), Hungarian (3.4%, a difference of 0.23%), Croatian (3.4%, a difference of 0.44%), Austrian (3.4%, a difference of 0.54%), and Lithuanian (3.4%, a difference of 0.76%).
| Demographics | Rating | Rank | Hearing Disability |
| Immigrants | Western Europe | 1.0 /100 | #243 | Tragic 3.3% |
| Assyrians/Chaldeans/Syriacs | 0.9 /100 | #244 | Tragic 3.3% |
| Immigrants | Scotland | 0.8 /100 | #245 | Tragic 3.3% |
| Immigrants | England | 0.7 /100 | #246 | Tragic 3.3% |
| Lithuanians | 0.6 /100 | #247 | Tragic 3.4% |
| Austrians | 0.6 /100 | #248 | Tragic 3.4% |
| Italians | 0.4 /100 | #249 | Tragic 3.4% |
| Yuman | 0.4 /100 | #250 | Tragic 3.4% |
| Hungarians | 0.4 /100 | #251 | Tragic 3.4% |
| Croatians | 0.4 /100 | #252 | Tragic 3.4% |
| Carpatho Rusyns | 0.3 /100 | #253 | Tragic 3.4% |
| Slavs | 0.2 /100 | #254 | Tragic 3.4% |
| Poles | 0.2 /100 | #255 | Tragic 3.4% |
| Hmong | 0.2 /100 | #256 | Tragic 3.4% |
| Yaqui | 0.2 /100 | #257 | Tragic 3.4% |