Cypriot vs Immigrants from Iran Hearing Disability

COMPARE

Cypriot
Race
Ancestry
AfghanAfricanAlaska NativeAlaskan AthabascanAlbanianAleutAlsatianAmericanApacheArabArapahoArgentineanArmenianAssyrian/Chaldean/SyriacAustralianAustrianBahamianBangladeshiBarbadianBasqueBelgianBelizeanBermudanBhutaneseBlackfeetBolivianBrazilianBritishBritish West IndianBulgarianBurmeseCajunCambodianCanadianCape VerdeanCarpatho RusynCelticCentral AmericanCentral American IndianCherokeeCheyenneChickasawChileanChineseChippewaChoctawColombianColvilleComancheCosta RicanCreeCreekCroatianCrowCubanCypriotCzechCzechoslovakianDanishDelawareDominicanDutchDutch West IndianEastern EuropeanEcuadorianEgyptianEnglishEstonianEthiopianEuropeanFijianFilipinoFinnishFrenchFrench American IndianFrench CanadianGermanGerman RussianGhanaianGreekGuamanian/ChamorroGuatemalanGuyaneseHaitianHmongHonduranHopiHoumaHungarianIcelanderIndian (Asian)IndonesianInupiatIranianIraqiIrishIroquoisIsraeliItalianJamaicanJapaneseJordanianKenyanKiowaKoreanLaotianLatvianLebaneseLiberianLithuanianLumbeeLuxembourgerMacedonianMalaysianMalteseMarshalleseMenomineeMexicanMexican American IndianMongolianMoroccanNative HawaiianNavajoNepaleseNew ZealanderNicaraguanNigerianNorthern EuropeanNorwegianOkinawanOsageOttawaPaiutePakistaniPalestinianPanamanianParaguayanPennsylvania GermanPeruvianPimaPolishPortuguesePotawatomiPuebloPuerto RicanPuget Sound SalishRomanianRussianSalvadoranSamoanScandinavianScotch-IrishScottishSeminoleSenegaleseSerbianShoshoneSierra LeoneanSiouxSlavicSlovakSloveneSomaliSouth AfricanSouth AmericanSouth American IndianSoviet UnionSpaniardSpanishSpanish AmericanSpanish American IndianSri LankanSubsaharan AfricanSudaneseSwedishSwissSyrianTaiwaneseThaiTlingit-HaidaTohono O'OdhamTonganTrinidadian and TobagonianTsimshianTurkishU.S. Virgin IslanderUgandanUkrainianUruguayanUteVenezuelanVietnameseWelshWest IndianYakamaYaquiYugoslavianYumanYup'ikZimbabwean
Immigration
NonimmigrantsImmigrantsAfghanistanAfricaAlbaniaArgentinaArmeniaAsiaAustraliaAustriaBahamasBangladeshBarbadosBelarusBelgiumBelizeBoliviaBosnia and HerzegovinaBrazilBulgariaBurma/MyanmarCabo VerdeCambodiaCameroonCanadaCaribbeanCentral AmericaChileChinaColombiaCongoCosta RicaCroatiaCubaCzechoslovakiaDenmarkDominicaDominican RepublicEastern AfricaEastern AsiaEastern EuropeEcuadorEgyptEl SalvadorEnglandEritreaEthiopiaEuropeFijiFranceGermanyGhanaGreeceGrenadaGuatemalaGuyanaHaitiHondurasHong KongHungaryIndiaIndonesiaIraqIrelandIsraelItalyJamaicaJapanJordanKazakhstanKenyaKoreaKuwaitLaosLatin AmericaLatviaLebanonLiberiaLithuaniaMalaysiaMexicoMicronesiaMiddle AfricaMoldovaMoroccoNepalNetherlandsNicaraguaNigeriaNorth AmericaNorth MacedoniaNorthern AfricaNorthern EuropeNorwayOceaniaPakistanPanamaPeruPhilippinesPolandPortugalRomaniaRussiaSaudi ArabiaScotlandSenegalSerbiaSierra LeoneSingaporeSomaliaSouth AfricaSouth AmericaSouth Central AsiaSouth Eastern AsiaSouthern EuropeSpainSri LankaSt. Vincent and the GrenadinesSudanSwedenSwitzerlandSyriaTaiwanThailandTrinidad and TobagoTurkeyUgandaUkraineUruguayUzbekistanVenezuelaVietnamWest IndiesWestern AfricaWestern AsiaWestern EuropeYemenZaireZimbabweAzores
Immigrants from Iran
Race
Ancestry
AfghanAfricanAlaska NativeAlaskan AthabascanAlbanianAleutAlsatianAmericanApacheArabArapahoArgentineanArmenianAssyrian/Chaldean/SyriacAustralianAustrianBahamianBangladeshiBarbadianBasqueBelgianBelizeanBermudanBhutaneseBlackfeetBolivianBrazilianBritishBritish West IndianBulgarianBurmeseCajunCambodianCanadianCape VerdeanCarpatho RusynCelticCentral AmericanCentral American IndianCherokeeCheyenneChickasawChileanChineseChippewaChoctawColombianColvilleComancheCosta RicanCreeCreekCroatianCrowCubanCzechCzechoslovakianDanishDelawareDominicanDutchDutch West IndianEastern EuropeanEcuadorianEgyptianEnglishEstonianEthiopianEuropeanFijianFilipinoFinnishFrenchFrench American IndianFrench CanadianGermanGerman RussianGhanaianGreekGuamanian/ChamorroGuatemalanGuyaneseHaitianHmongHonduranHopiHoumaHungarianIcelanderIndian (Asian)IndonesianInupiatIranianIraqiIrishIroquoisIsraeliItalianJamaicanJapaneseJordanianKenyanKiowaKoreanLaotianLatvianLebaneseLiberianLithuanianLumbeeLuxembourgerMacedonianMalaysianMalteseMarshalleseMenomineeMexicanMexican American IndianMongolianMoroccanNative HawaiianNavajoNepaleseNew ZealanderNicaraguanNigerianNorthern EuropeanNorwegianOkinawanOsageOttawaPaiutePakistaniPalestinianPanamanianParaguayanPennsylvania GermanPeruvianPimaPolishPortuguesePotawatomiPuebloPuerto RicanPuget Sound SalishRomanianRussianSalvadoranSamoanScandinavianScotch-IrishScottishSeminoleSenegaleseSerbianShoshoneSierra LeoneanSiouxSlavicSlovakSloveneSomaliSouth AfricanSouth AmericanSouth American IndianSoviet UnionSpaniardSpanishSpanish AmericanSpanish American IndianSri LankanSubsaharan AfricanSudaneseSwedishSwissSyrianTaiwaneseThaiTlingit-HaidaTohono O'OdhamTonganTrinidadian and TobagonianTsimshianTurkishU.S. Virgin IslanderUgandanUkrainianUruguayanUteVenezuelanVietnameseWelshWest IndianYakamaYaquiYugoslavianYumanYup'ikZimbabwean
Immigration
NonimmigrantsImmigrantsAfghanistanAfricaAlbaniaArgentinaArmeniaAsiaAustraliaAustriaBahamasBangladeshBarbadosBelarusBelgiumBelizeBoliviaBosnia and HerzegovinaBrazilBulgariaBurma/MyanmarCabo VerdeCambodiaCameroonCanadaCaribbeanCentral AmericaChileChinaColombiaCongoCosta RicaCroatiaCubaCzechoslovakiaDenmarkDominicaDominican RepublicEastern AfricaEastern AsiaEastern EuropeEcuadorEgyptEl SalvadorEnglandEritreaEthiopiaEuropeFijiFranceGermanyGhanaGreeceGrenadaGuatemalaGuyanaHaitiHondurasHong KongHungaryIndiaIndonesiaIranIraqIrelandIsraelItalyJamaicaJapanJordanKazakhstanKenyaKoreaKuwaitLaosLatin AmericaLatviaLebanonLiberiaLithuaniaMalaysiaMexicoMicronesiaMiddle AfricaMoldovaMoroccoNepalNetherlandsNicaraguaNigeriaNorth AmericaNorth MacedoniaNorthern AfricaNorthern EuropeNorwayOceaniaPakistanPanamaPeruPhilippinesPolandPortugalRomaniaRussiaSaudi ArabiaScotlandSenegalSerbiaSierra LeoneSingaporeSomaliaSouth AfricaSouth AmericaSouth Central AsiaSouth Eastern AsiaSouthern EuropeSpainSri LankaSt. Vincent and the GrenadinesSudanSwedenSwitzerlandSyriaTaiwanThailandTrinidad and TobagoTurkeyUgandaUkraineUruguayUzbekistanVenezuelaVietnamWest IndiesWestern AfricaWestern AsiaWestern EuropeYemenZaireZimbabweAzores
Hearing Disability
Income
Poverty
Unemployment
Labor Participation
Family Structure
Vehicle Availability
Education Level
Disability

Hearing Disability Comparison

Cypriots

Immigrants from Iran

Exceptional
Exceptional
2.8%
HEARING DISABILITY
92.9/ 100
METRIC RATING
110th/ 347
METRIC RANK
2.8%
HEARING DISABILITY
96.8/ 100
METRIC RATING
86th/ 347
METRIC RANK

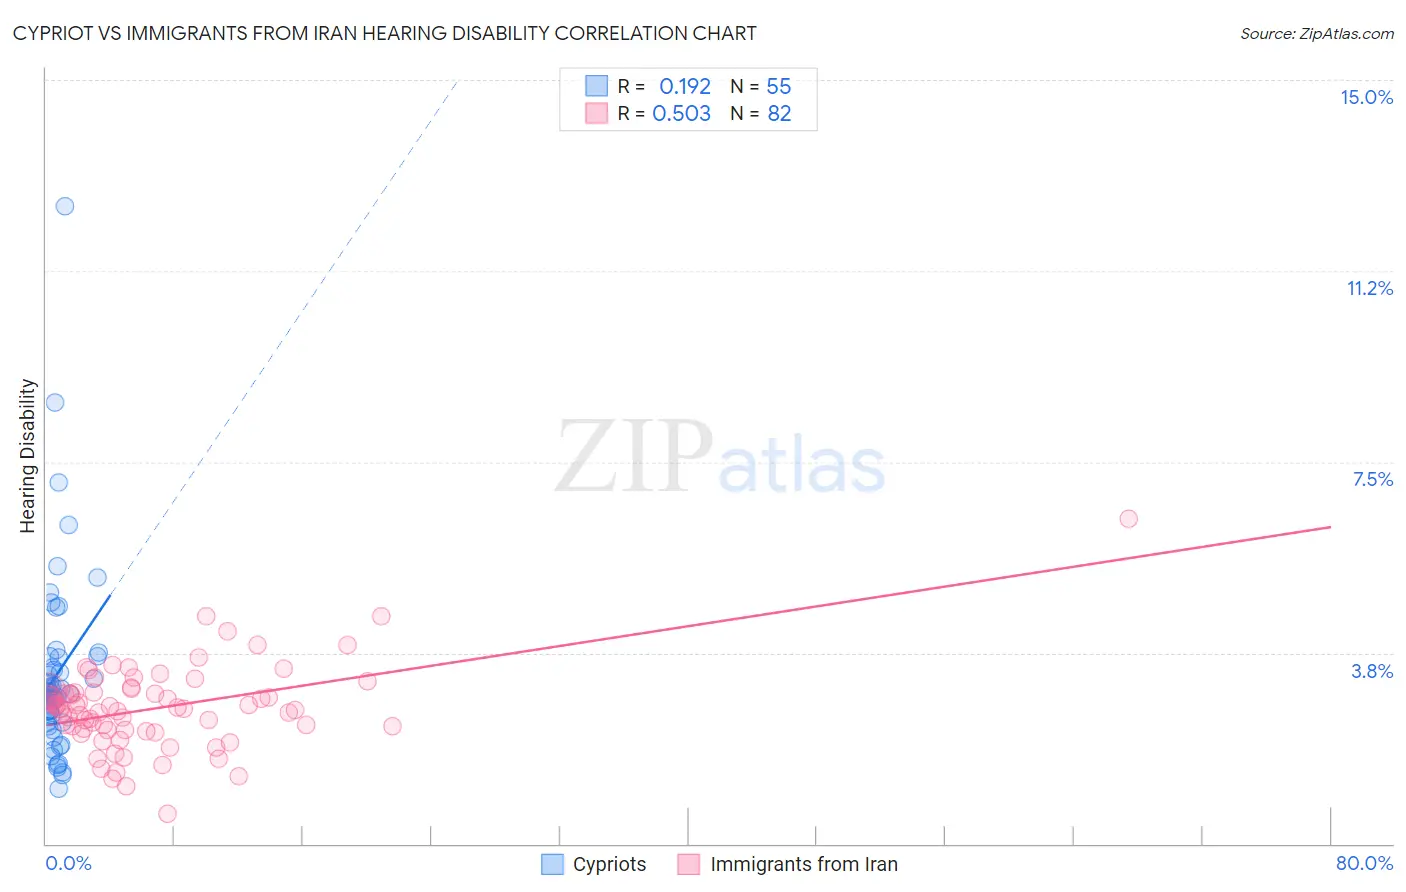
Cypriot vs Immigrants from Iran Hearing Disability Correlation Chart

The statistical analysis conducted on geographies consisting of 61,868,814 people shows a poor positive correlation between the proportion of Cypriots and percentage of population with hearing disability in the United States with a correlation coefficient (R) of 0.192 and weighted average of 2.8%. Similarly, the statistical analysis conducted on geographies consisting of 279,867,753 people shows a substantial positive correlation between the proportion of Immigrants from Iran and percentage of population with hearing disability in the United States with a correlation coefficient (R) of 0.503 and weighted average of 2.8%, a difference of 2.2%.
Cypriot vs Immigrants from Iran Hearing Disability

Hearing Disability Correlation Summary

MeasurementCypriotImmigrants from Iran
Minimum1.1%0.60%
Maximum12.5%6.4%
Range11.4%5.8%
Mean3.3%2.7%
Median3.0%2.7%
Interquartile 25% (IQ1)2.4%2.2%
Interquartile 75% (IQ3)3.7%3.0%
Interquartile Range (IQR)1.3%0.74%
Standard Deviation (Sample)1.9%0.83%
Standard Deviation (Population)1.9%0.82%

Similar Demographics by Hearing Disability

Demographics Similar to Cypriots by Hearing Disability

In terms of hearing disability, the demographic groups most similar to Cypriots are Turkish (2.8%, a difference of 0.050%), Immigrants from Yemen (2.8%, a difference of 0.050%), Guatemalan (2.8%, a difference of 0.12%), U.S. Virgin Islander (2.8%, a difference of 0.12%), and Honduran (2.8%, a difference of 0.20%).
DemographicsRating | RankHearing Disability
Immigrants | Indonesia
94.7
/100
|
#103
Exceptional
2.8%
Burmese
94.2
/100
|
#104
Exceptional
2.8%
Moroccans
93.9
/100
|
#105
Exceptional
2.8%
Hondurans
93.4
/100
|
#106
Exceptional
2.8%
Immigrants | Chile
93.4
/100
|
#107
Exceptional
2.8%
Guatemalans
93.2
/100
|
#108
Exceptional
2.8%
Turks
93.0
/100
|
#109
Exceptional
2.8%
Cypriots
92.9
/100
|
#110
Exceptional
2.8%
Immigrants | Yemen
92.7
/100
|
#111
Exceptional
2.8%
U.S. Virgin Islanders
92.5
/100
|
#112
Exceptional
2.8%
Immigrants | Belarus
91.6
/100
|
#113
Exceptional
2.8%
Cambodians
91.1
/100
|
#114
Exceptional
2.8%
Immigrants | Latin America
90.5
/100
|
#115
Exceptional
2.8%
Immigrants | Immigrants
90.3
/100
|
#116
Exceptional
2.8%
Immigrants | Liberia
90.0
/100
|
#117
Excellent
2.8%

Demographics Similar to Immigrants from Iran by Hearing Disability

In terms of hearing disability, the demographic groups most similar to Immigrants from Iran are Immigrants from Northern Africa (2.8%, a difference of 0.020%), Immigrants from Argentina (2.8%, a difference of 0.10%), Somali (2.8%, a difference of 0.11%), Immigrants from Turkey (2.8%, a difference of 0.14%), and Belizean (2.8%, a difference of 0.17%).
DemographicsRating | RankHearing Disability
Colombians
97.4
/100
|
#79
Exceptional
2.7%
Immigrants | Asia
97.2
/100
|
#80
Exceptional
2.7%
Immigrants | Uruguay
97.2
/100
|
#81
Exceptional
2.7%
Immigrants | Armenia
97.2
/100
|
#82
Exceptional
2.7%
Immigrants | Cuba
97.2
/100
|
#83
Exceptional
2.7%
Immigrants | Argentina
97.0
/100
|
#84
Exceptional
2.8%
Immigrants | Northern Africa
96.9
/100
|
#85
Exceptional
2.8%
Immigrants | Iran
96.8
/100
|
#86
Exceptional
2.8%
Somalis
96.7
/100
|
#87
Exceptional
2.8%
Immigrants | Turkey
96.7
/100
|
#88
Exceptional
2.8%
Belizeans
96.6
/100
|
#89
Exceptional
2.8%
Immigrants | Morocco
96.6
/100
|
#90
Exceptional
2.8%
Immigrants | Middle Africa
96.5
/100
|
#91
Exceptional
2.8%
Iranians
96.4
/100
|
#92
Exceptional
2.8%
Immigrants | Kuwait
96.3
/100
|
#93
Exceptional
2.8%