Cypriot vs Immigrants from Turkey Disability Age 5 to 17
COMPARE
Cypriot
Immigrants from Turkey
Disability Age 5 to 17
Disability Age 5 to 17 Comparison
Cypriots
Immigrants from Turkey
5.3%
DISABILITY AGE 5 TO 17
97.7/ 100
METRIC RATING
116th/ 347
METRIC RANK
5.1%
DISABILITY AGE 5 TO 17
99.9/ 100
METRIC RATING
56th/ 347
METRIC RANK
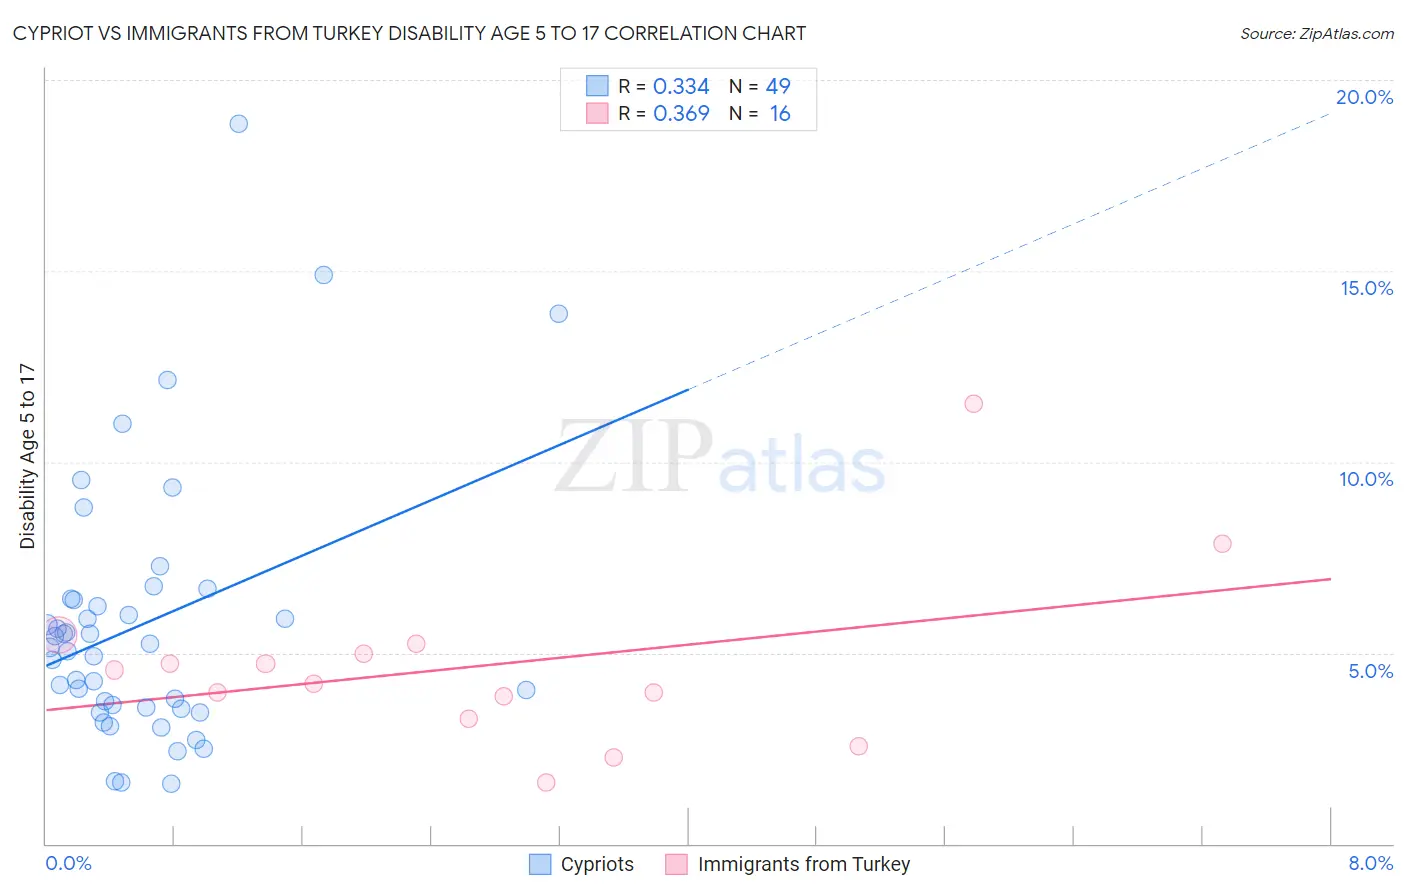
Cypriot vs Immigrants from Turkey Disability Age 5 to 17 Correlation Chart
The statistical analysis conducted on geographies consisting of 61,709,626 people shows a mild positive correlation between the proportion of Cypriots and percentage of population with a disability between the ages 5 and 17 in the United States with a correlation coefficient (R) of 0.334 and weighted average of 5.3%. Similarly, the statistical analysis conducted on geographies consisting of 221,880,411 people shows a mild positive correlation between the proportion of Immigrants from Turkey and percentage of population with a disability between the ages 5 and 17 in the United States with a correlation coefficient (R) of 0.369 and weighted average of 5.1%, a difference of 4.5%.
Disability Age 5 to 17 Correlation Summary
| Measurement | Cypriot | Immigrants from Turkey |
| Minimum | 1.6% | 1.6% |
| Maximum | 18.9% | 11.5% |
| Range | 17.3% | 9.9% |
| Mean | 5.8% | 4.7% |
| Median | 5.2% | 4.4% |
| Interquartile 25% (IQ1) | 3.6% | 3.6% |
| Interquartile 75% (IQ3) | 6.4% | 5.1% |
| Interquartile Range (IQR) | 2.9% | 1.5% |
| Standard Deviation (Sample) | 3.5% | 2.3% |
| Standard Deviation (Population) | 3.5% | 2.3% |
Similar Demographics by Disability Age 5 to 17
Demographics Similar to Cypriots by Disability Age 5 to 17
In terms of disability age 5 to 17, the demographic groups most similar to Cypriots are Cuban (5.3%, a difference of 0.060%), Immigrants from Northern Europe (5.3%, a difference of 0.080%), Aleut (5.3%, a difference of 0.10%), Immigrants from Latvia (5.3%, a difference of 0.15%), and Ethiopian (5.3%, a difference of 0.16%).
| Demographics | Rating | Rank | Disability Age 5 to 17 |
| Immigrants | Northern Africa | 98.1 /100 | #109 | Exceptional 5.3% |
| Immigrants | Eritrea | 98.0 /100 | #110 | Exceptional 5.3% |
| Ethiopians | 97.9 /100 | #111 | Exceptional 5.3% |
| Immigrants | Latvia | 97.9 /100 | #112 | Exceptional 5.3% |
| Aleuts | 97.8 /100 | #113 | Exceptional 5.3% |
| Immigrants | Northern Europe | 97.8 /100 | #114 | Exceptional 5.3% |
| Cubans | 97.8 /100 | #115 | Exceptional 5.3% |
| Cypriots | 97.7 /100 | #116 | Exceptional 5.3% |
| Immigrants | Afghanistan | 97.4 /100 | #117 | Exceptional 5.3% |
| South Americans | 97.1 /100 | #118 | Exceptional 5.4% |
| Immigrants | South America | 97.1 /100 | #119 | Exceptional 5.4% |
| Immigrants | Immigrants | 97.0 /100 | #120 | Exceptional 5.4% |
| Maltese | 96.0 /100 | #121 | Exceptional 5.4% |
| Chileans | 95.8 /100 | #122 | Exceptional 5.4% |
| Immigrants | Ethiopia | 95.5 /100 | #123 | Exceptional 5.4% |
Demographics Similar to Immigrants from Turkey by Disability Age 5 to 17
In terms of disability age 5 to 17, the demographic groups most similar to Immigrants from Turkey are Laotian (5.1%, a difference of 0.010%), Paraguayan (5.1%, a difference of 0.060%), Immigrants from Lithuania (5.1%, a difference of 0.090%), Immigrants from Fiji (5.1%, a difference of 0.14%), and Immigrants from Poland (5.1%, a difference of 0.14%).
| Demographics | Rating | Rank | Disability Age 5 to 17 |
| Immigrants | Western Asia | 100.0 /100 | #49 | Exceptional 5.1% |
| Argentineans | 99.9 /100 | #50 | Exceptional 5.1% |
| Turks | 99.9 /100 | #51 | Exceptional 5.1% |
| Immigrants | Fiji | 99.9 /100 | #52 | Exceptional 5.1% |
| Immigrants | Lithuania | 99.9 /100 | #53 | Exceptional 5.1% |
| Paraguayans | 99.9 /100 | #54 | Exceptional 5.1% |
| Laotians | 99.9 /100 | #55 | Exceptional 5.1% |
| Immigrants | Turkey | 99.9 /100 | #56 | Exceptional 5.1% |
| Immigrants | Poland | 99.9 /100 | #57 | Exceptional 5.1% |
| Immigrants | Ukraine | 99.9 /100 | #58 | Exceptional 5.1% |
| Immigrants | North Macedonia | 99.9 /100 | #59 | Exceptional 5.1% |
| Immigrants | Eastern Europe | 99.9 /100 | #60 | Exceptional 5.1% |
| Immigrants | Switzerland | 99.8 /100 | #61 | Exceptional 5.2% |
| Immigrants | Ireland | 99.8 /100 | #62 | Exceptional 5.2% |
| Immigrants | Bangladesh | 99.8 /100 | #63 | Exceptional 5.2% |