Nonimmigrants vs American Disability Age Over 75
COMPARE
Nonimmigrants
American
Disability Age Over 75
Disability Age Over 75 Comparison
Nonimmigrants
Americans
48.0%
DISABILITY AGE OVER 75
6.5/ 100
METRIC RATING
226th/ 347
METRIC RANK
48.4%
DISABILITY AGE OVER 75
1.7/ 100
METRIC RATING
245th/ 347
METRIC RANK
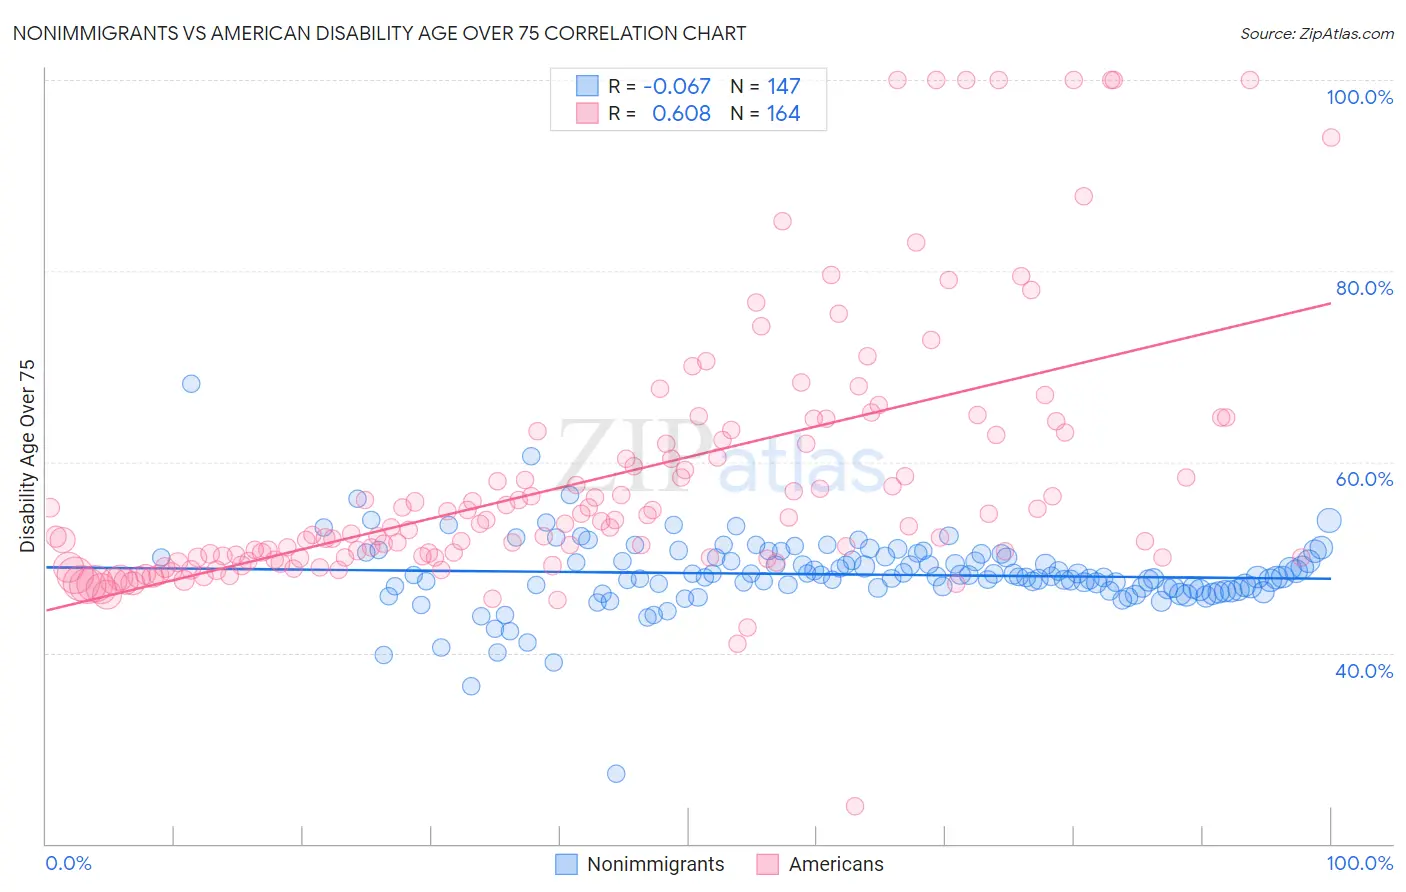
Nonimmigrants vs American Disability Age Over 75 Correlation Chart
The statistical analysis conducted on geographies consisting of 582,018,698 people shows a slight negative correlation between the proportion of Nonimmigrants and percentage of population with a disability over the age of 75 in the United States with a correlation coefficient (R) of -0.067 and weighted average of 48.0%. Similarly, the statistical analysis conducted on geographies consisting of 579,462,277 people shows a significant positive correlation between the proportion of Americans and percentage of population with a disability over the age of 75 in the United States with a correlation coefficient (R) of 0.608 and weighted average of 48.4%, a difference of 0.76%.
Disability Age Over 75 Correlation Summary
| Measurement | Nonimmigrants | American |
| Minimum | 27.4% | 23.9% |
| Maximum | 68.2% | 100.0% |
| Range | 40.9% | 76.1% |
| Mean | 48.2% | 58.0% |
| Median | 47.9% | 53.4% |
| Interquartile 25% (IQ1) | 46.7% | 50.0% |
| Interquartile 75% (IQ3) | 50.0% | 62.0% |
| Interquartile Range (IQR) | 3.3% | 12.1% |
| Standard Deviation (Sample) | 4.0% | 13.5% |
| Standard Deviation (Population) | 4.0% | 13.4% |
Demographics Similar to Nonimmigrants and Americans by Disability Age Over 75
In terms of disability age over 75, the demographic groups most similar to Nonimmigrants are Spanish (48.0%, a difference of 0.010%), Zimbabwean (48.1%, a difference of 0.010%), Immigrants from Liberia (48.1%, a difference of 0.050%), Spaniard (48.1%, a difference of 0.070%), and Taiwanese (48.2%, a difference of 0.22%). Similarly, the demographic groups most similar to Americans are Afghan (48.4%, a difference of 0.020%), Immigrants from Caribbean (48.4%, a difference of 0.11%), Native Hawaiian (48.3%, a difference of 0.15%), French American Indian (48.3%, a difference of 0.15%), and Tongan (48.3%, a difference of 0.16%).
| Demographics | Rating | Rank | Disability Age Over 75 |
| Spanish | 6.5 /100 | #225 | Tragic 48.0% |
| Immigrants | Nonimmigrants | 6.5 /100 | #226 | Tragic 48.0% |
| Zimbabweans | 6.4 /100 | #227 | Tragic 48.1% |
| Immigrants | Liberia | 5.9 /100 | #228 | Tragic 48.1% |
| Spaniards | 5.7 /100 | #229 | Tragic 48.1% |
| Taiwanese | 4.4 /100 | #230 | Tragic 48.2% |
| Immigrants | Immigrants | 4.3 /100 | #231 | Tragic 48.2% |
| Indonesians | 4.2 /100 | #232 | Tragic 48.2% |
| Cree | 4.2 /100 | #233 | Tragic 48.2% |
| Sub-Saharan Africans | 3.8 /100 | #234 | Tragic 48.2% |
| Hmong | 3.8 /100 | #235 | Tragic 48.2% |
| Immigrants | Nicaragua | 3.2 /100 | #236 | Tragic 48.2% |
| Immigrants | St. Vincent and the Grenadines | 3.2 /100 | #237 | Tragic 48.2% |
| Nicaraguans | 3.0 /100 | #238 | Tragic 48.3% |
| Immigrants | Thailand | 2.8 /100 | #239 | Tragic 48.3% |
| Tongans | 2.3 /100 | #240 | Tragic 48.3% |
| Native Hawaiians | 2.2 /100 | #241 | Tragic 48.3% |
| French American Indians | 2.2 /100 | #242 | Tragic 48.3% |
| Immigrants | Caribbean | 2.1 /100 | #243 | Tragic 48.4% |
| Afghans | 1.8 /100 | #244 | Tragic 48.4% |
| Americans | 1.7 /100 | #245 | Tragic 48.4% |