Immigrants from Russia vs American Disability Age Over 75
COMPARE
Immigrants from Russia
American
Disability Age Over 75
Disability Age Over 75 Comparison
Immigrants from Russia
Americans
47.0%
DISABILITY AGE OVER 75
79.3/ 100
METRIC RATING
150th/ 347
METRIC RANK
48.4%
DISABILITY AGE OVER 75
1.7/ 100
METRIC RATING
245th/ 347
METRIC RANK
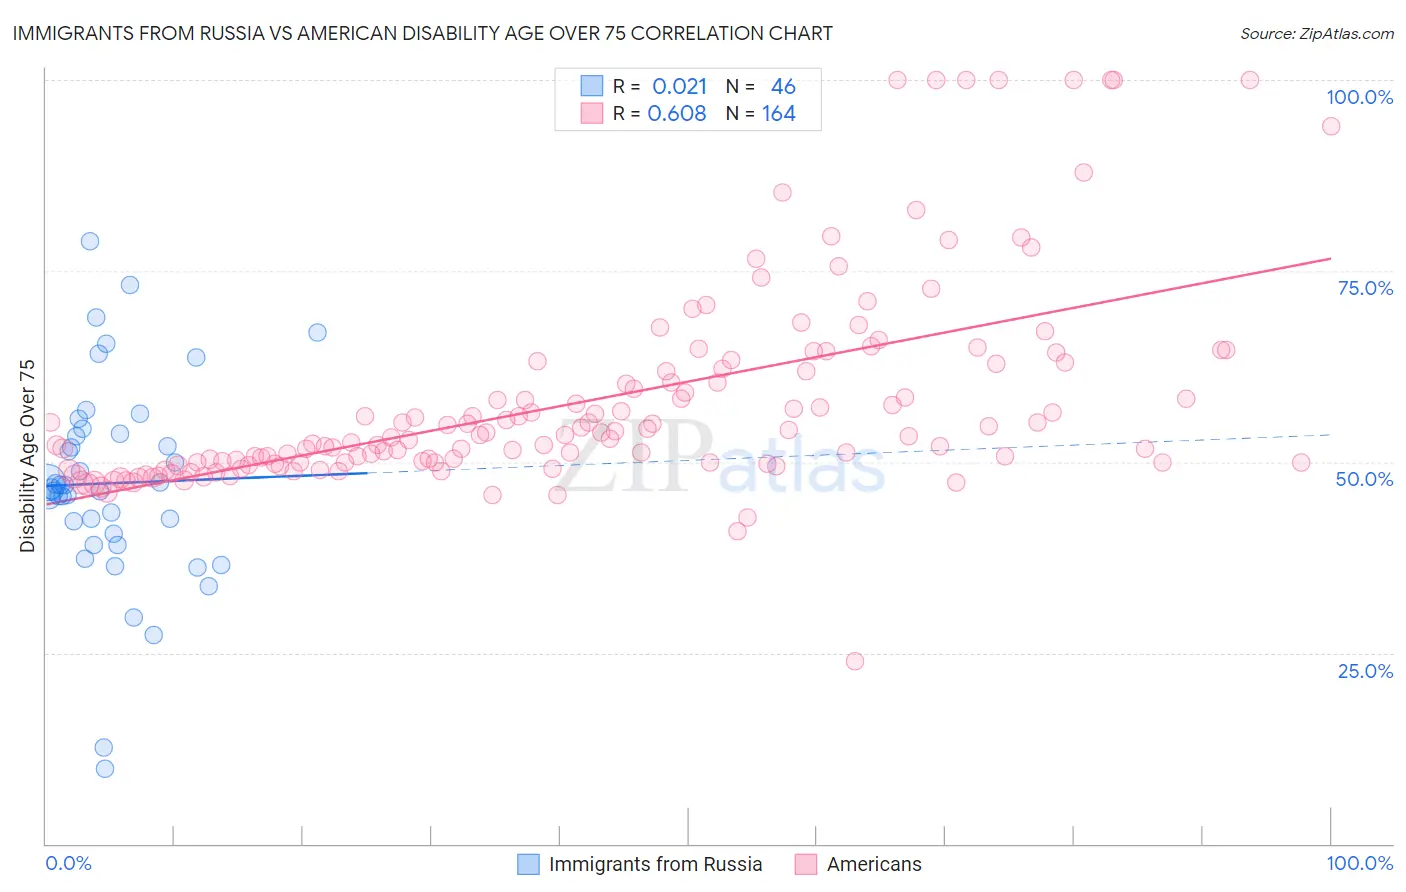
Immigrants from Russia vs American Disability Age Over 75 Correlation Chart
The statistical analysis conducted on geographies consisting of 347,296,356 people shows no correlation between the proportion of Immigrants from Russia and percentage of population with a disability over the age of 75 in the United States with a correlation coefficient (R) of 0.021 and weighted average of 47.0%. Similarly, the statistical analysis conducted on geographies consisting of 579,462,277 people shows a significant positive correlation between the proportion of Americans and percentage of population with a disability over the age of 75 in the United States with a correlation coefficient (R) of 0.608 and weighted average of 48.4%, a difference of 3.0%.
Disability Age Over 75 Correlation Summary
| Measurement | Immigrants from Russia | American |
| Minimum | 9.8% | 23.9% |
| Maximum | 78.9% | 100.0% |
| Range | 69.1% | 76.1% |
| Mean | 47.2% | 58.0% |
| Median | 46.7% | 53.4% |
| Interquartile 25% (IQ1) | 40.6% | 50.0% |
| Interquartile 75% (IQ3) | 53.7% | 62.0% |
| Interquartile Range (IQR) | 13.0% | 12.1% |
| Standard Deviation (Sample) | 13.4% | 13.5% |
| Standard Deviation (Population) | 13.3% | 13.4% |
Similar Demographics by Disability Age Over 75
Demographics Similar to Immigrants from Russia by Disability Age Over 75
In terms of disability age over 75, the demographic groups most similar to Immigrants from Russia are French Canadian (47.0%, a difference of 0.010%), Welsh (47.0%, a difference of 0.070%), Asian (46.9%, a difference of 0.080%), Immigrants from Asia (47.0%, a difference of 0.090%), and Immigrants from Zaire (47.1%, a difference of 0.14%).
| Demographics | Rating | Rank | Disability Age Over 75 |
| Bermudans | 85.6 /100 | #143 | Excellent 46.9% |
| Venezuelans | 85.0 /100 | #144 | Excellent 46.9% |
| Costa Ricans | 84.5 /100 | #145 | Excellent 46.9% |
| Guyanese | 84.3 /100 | #146 | Excellent 46.9% |
| Immigrants | Peru | 84.1 /100 | #147 | Excellent 46.9% |
| Asians | 81.6 /100 | #148 | Excellent 46.9% |
| Welsh | 81.3 /100 | #149 | Excellent 47.0% |
| Immigrants | Russia | 79.3 /100 | #150 | Good 47.0% |
| French Canadians | 79.0 /100 | #151 | Good 47.0% |
| Immigrants | Asia | 76.5 /100 | #152 | Good 47.0% |
| Immigrants | Zaire | 74.8 /100 | #153 | Good 47.1% |
| Immigrants | Belarus | 74.8 /100 | #154 | Good 47.1% |
| Immigrants | Iran | 74.7 /100 | #155 | Good 47.1% |
| Arabs | 73.3 /100 | #156 | Good 47.1% |
| Bhutanese | 72.6 /100 | #157 | Good 47.1% |
Demographics Similar to Americans by Disability Age Over 75
In terms of disability age over 75, the demographic groups most similar to Americans are Afghan (48.4%, a difference of 0.020%), Chippewa (48.4%, a difference of 0.030%), Iroquois (48.4%, a difference of 0.050%), Immigrants from Caribbean (48.4%, a difference of 0.11%), and Sri Lankan (48.5%, a difference of 0.11%).
| Demographics | Rating | Rank | Disability Age Over 75 |
| Nicaraguans | 3.0 /100 | #238 | Tragic 48.3% |
| Immigrants | Thailand | 2.8 /100 | #239 | Tragic 48.3% |
| Tongans | 2.3 /100 | #240 | Tragic 48.3% |
| Native Hawaiians | 2.2 /100 | #241 | Tragic 48.3% |
| French American Indians | 2.2 /100 | #242 | Tragic 48.3% |
| Immigrants | Caribbean | 2.1 /100 | #243 | Tragic 48.4% |
| Afghans | 1.8 /100 | #244 | Tragic 48.4% |
| Americans | 1.7 /100 | #245 | Tragic 48.4% |
| Chippewa | 1.6 /100 | #246 | Tragic 48.4% |
| Iroquois | 1.6 /100 | #247 | Tragic 48.4% |
| Sri Lankans | 1.4 /100 | #248 | Tragic 48.5% |
| Iraqis | 1.0 /100 | #249 | Tragic 48.6% |
| West Indians | 0.8 /100 | #250 | Tragic 48.6% |
| Koreans | 0.8 /100 | #251 | Tragic 48.6% |
| Immigrants | South Eastern Asia | 0.7 /100 | #252 | Tragic 48.7% |