Sri Lankan vs American Disability Age Over 75
COMPARE
Sri Lankan
American
Disability Age Over 75
Disability Age Over 75 Comparison
Sri Lankans
Americans
48.5%
DISABILITY AGE OVER 75
1.4/ 100
METRIC RATING
248th/ 347
METRIC RANK
48.4%
DISABILITY AGE OVER 75
1.7/ 100
METRIC RATING
245th/ 347
METRIC RANK
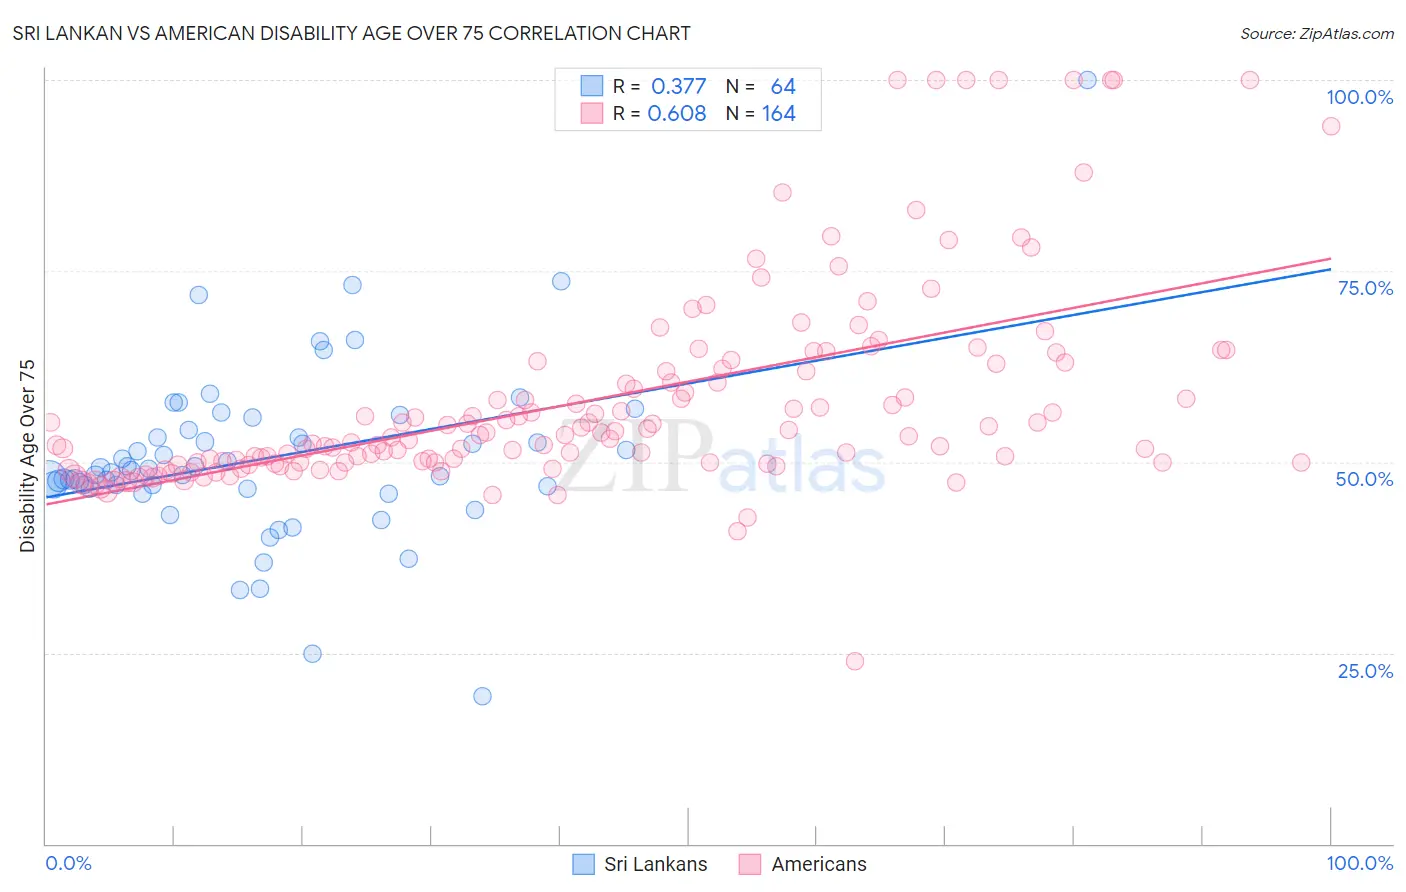
Sri Lankan vs American Disability Age Over 75 Correlation Chart
The statistical analysis conducted on geographies consisting of 439,378,477 people shows a mild positive correlation between the proportion of Sri Lankans and percentage of population with a disability over the age of 75 in the United States with a correlation coefficient (R) of 0.377 and weighted average of 48.5%. Similarly, the statistical analysis conducted on geographies consisting of 579,462,277 people shows a significant positive correlation between the proportion of Americans and percentage of population with a disability over the age of 75 in the United States with a correlation coefficient (R) of 0.608 and weighted average of 48.4%, a difference of 0.11%.
Disability Age Over 75 Correlation Summary
| Measurement | Sri Lankan | American |
| Minimum | 19.3% | 23.9% |
| Maximum | 100.0% | 100.0% |
| Range | 80.7% | 76.1% |
| Mean | 50.4% | 58.0% |
| Median | 48.8% | 53.4% |
| Interquartile 25% (IQ1) | 46.6% | 50.0% |
| Interquartile 75% (IQ3) | 53.7% | 62.0% |
| Interquartile Range (IQR) | 7.0% | 12.1% |
| Standard Deviation (Sample) | 11.5% | 13.5% |
| Standard Deviation (Population) | 11.4% | 13.4% |
Demographics Similar to Sri Lankans and Americans by Disability Age Over 75
In terms of disability age over 75, the demographic groups most similar to Sri Lankans are Iroquois (48.4%, a difference of 0.060%), Chippewa (48.4%, a difference of 0.080%), Afghan (48.4%, a difference of 0.14%), Iraqi (48.6%, a difference of 0.21%), and Immigrants from Caribbean (48.4%, a difference of 0.22%). Similarly, the demographic groups most similar to Americans are Afghan (48.4%, a difference of 0.020%), Chippewa (48.4%, a difference of 0.030%), Iroquois (48.4%, a difference of 0.050%), Immigrants from Caribbean (48.4%, a difference of 0.11%), and Native Hawaiian (48.3%, a difference of 0.15%).
| Demographics | Rating | Rank | Disability Age Over 75 |
| Immigrants | Nicaragua | 3.2 /100 | #236 | Tragic 48.2% |
| Immigrants | St. Vincent and the Grenadines | 3.2 /100 | #237 | Tragic 48.2% |
| Nicaraguans | 3.0 /100 | #238 | Tragic 48.3% |
| Immigrants | Thailand | 2.8 /100 | #239 | Tragic 48.3% |
| Tongans | 2.3 /100 | #240 | Tragic 48.3% |
| Native Hawaiians | 2.2 /100 | #241 | Tragic 48.3% |
| French American Indians | 2.2 /100 | #242 | Tragic 48.3% |
| Immigrants | Caribbean | 2.1 /100 | #243 | Tragic 48.4% |
| Afghans | 1.8 /100 | #244 | Tragic 48.4% |
| Americans | 1.7 /100 | #245 | Tragic 48.4% |
| Chippewa | 1.6 /100 | #246 | Tragic 48.4% |
| Iroquois | 1.6 /100 | #247 | Tragic 48.4% |
| Sri Lankans | 1.4 /100 | #248 | Tragic 48.5% |
| Iraqis | 1.0 /100 | #249 | Tragic 48.6% |
| West Indians | 0.8 /100 | #250 | Tragic 48.6% |
| Koreans | 0.8 /100 | #251 | Tragic 48.6% |
| Immigrants | South Eastern Asia | 0.7 /100 | #252 | Tragic 48.7% |
| British West Indians | 0.6 /100 | #253 | Tragic 48.7% |
| Immigrants | Vietnam | 0.6 /100 | #254 | Tragic 48.7% |
| Chinese | 0.5 /100 | #255 | Tragic 48.7% |
| Immigrants | Congo | 0.5 /100 | #256 | Tragic 48.7% |