Crow vs Mexican Disability Age Over 75
COMPARE
Crow
Mexican
Disability Age Over 75
Disability Age Over 75 Comparison
Crow
Mexicans
49.6%
DISABILITY AGE OVER 75
0.0/ 100
METRIC RATING
285th/ 347
METRIC RANK
51.1%
DISABILITY AGE OVER 75
0.0/ 100
METRIC RATING
315th/ 347
METRIC RANK
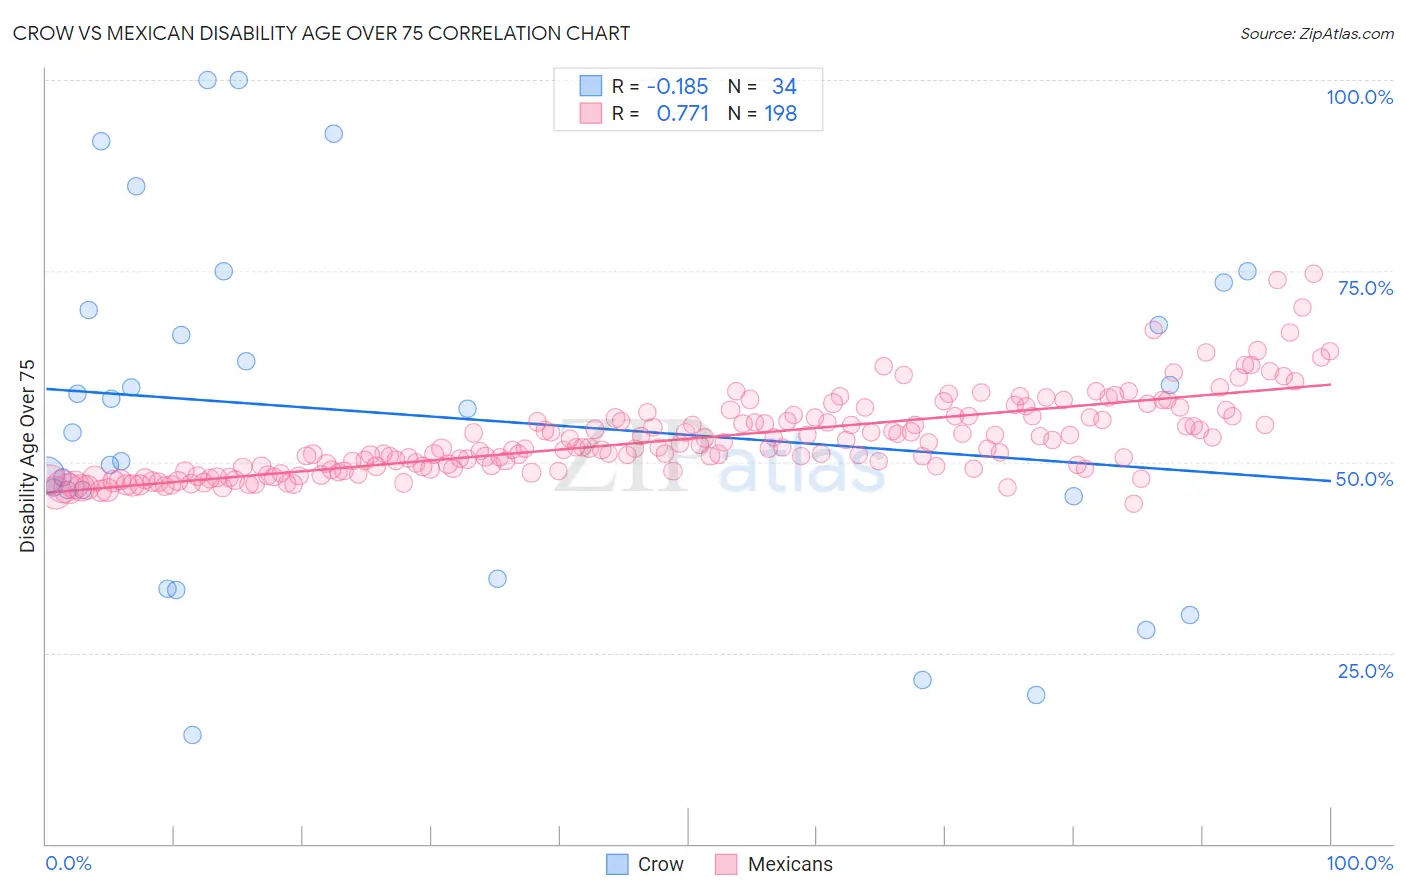
Crow vs Mexican Disability Age Over 75 Correlation Chart
The statistical analysis conducted on geographies consisting of 59,157,590 people shows a poor negative correlation between the proportion of Crow and percentage of population with a disability over the age of 75 in the United States with a correlation coefficient (R) of -0.185 and weighted average of 49.6%. Similarly, the statistical analysis conducted on geographies consisting of 562,773,685 people shows a strong positive correlation between the proportion of Mexicans and percentage of population with a disability over the age of 75 in the United States with a correlation coefficient (R) of 0.771 and weighted average of 51.1%, a difference of 3.1%.
Disability Age Over 75 Correlation Summary
| Measurement | Crow | Mexican |
| Minimum | 14.3% | 44.5% |
| Maximum | 100.0% | 74.6% |
| Range | 85.7% | 30.1% |
| Mean | 56.0% | 53.0% |
| Median | 55.4% | 51.7% |
| Interquartile 25% (IQ1) | 45.5% | 48.9% |
| Interquartile 75% (IQ3) | 69.9% | 55.9% |
| Interquartile Range (IQR) | 24.4% | 6.9% |
| Standard Deviation (Sample) | 22.6% | 5.3% |
| Standard Deviation (Population) | 22.2% | 5.3% |
Similar Demographics by Disability Age Over 75
Demographics Similar to Crow by Disability Age Over 75
In terms of disability age over 75, the demographic groups most similar to Crow are Immigrants from Belize (49.6%, a difference of 0.080%), Immigrants from Latin America (49.5%, a difference of 0.13%), Samoan (49.5%, a difference of 0.19%), Black/African American (49.5%, a difference of 0.21%), and Sioux (49.7%, a difference of 0.29%).
| Demographics | Rating | Rank | Disability Age Over 75 |
| Immigrants | Laos | 0.1 /100 | #278 | Tragic 49.2% |
| Guamanians/Chamorros | 0.0 /100 | #279 | Tragic 49.4% |
| Bangladeshis | 0.0 /100 | #280 | Tragic 49.4% |
| Belizeans | 0.0 /100 | #281 | Tragic 49.4% |
| Blacks/African Americans | 0.0 /100 | #282 | Tragic 49.5% |
| Samoans | 0.0 /100 | #283 | Tragic 49.5% |
| Immigrants | Latin America | 0.0 /100 | #284 | Tragic 49.5% |
| Crow | 0.0 /100 | #285 | Tragic 49.6% |
| Immigrants | Belize | 0.0 /100 | #286 | Tragic 49.6% |
| Sioux | 0.0 /100 | #287 | Tragic 49.7% |
| Yaqui | 0.0 /100 | #288 | Tragic 49.8% |
| Osage | 0.0 /100 | #289 | Tragic 49.8% |
| Puget Sound Salish | 0.0 /100 | #290 | Tragic 49.8% |
| Arapaho | 0.0 /100 | #291 | Tragic 49.8% |
| Shoshone | 0.0 /100 | #292 | Tragic 49.9% |
Demographics Similar to Mexicans by Disability Age Over 75
In terms of disability age over 75, the demographic groups most similar to Mexicans are Immigrants from Mexico (51.1%, a difference of 0.050%), Chickasaw (51.2%, a difference of 0.14%), Yakama (51.3%, a difference of 0.32%), Immigrants from the Azores (50.9%, a difference of 0.42%), and Cheyenne (50.9%, a difference of 0.47%).
| Demographics | Rating | Rank | Disability Age Over 75 |
| Hispanics or Latinos | 0.0 /100 | #308 | Tragic 50.6% |
| Aleuts | 0.0 /100 | #309 | Tragic 50.6% |
| Tlingit-Haida | 0.0 /100 | #310 | Tragic 50.6% |
| Cajuns | 0.0 /100 | #311 | Tragic 50.7% |
| Cheyenne | 0.0 /100 | #312 | Tragic 50.9% |
| Immigrants | Azores | 0.0 /100 | #313 | Tragic 50.9% |
| Immigrants | Mexico | 0.0 /100 | #314 | Tragic 51.1% |
| Mexicans | 0.0 /100 | #315 | Tragic 51.1% |
| Chickasaw | 0.0 /100 | #316 | Tragic 51.2% |
| Yakama | 0.0 /100 | #317 | Tragic 51.3% |
| Seminole | 0.0 /100 | #318 | Tragic 51.5% |
| Creek | 0.0 /100 | #319 | Tragic 51.5% |
| Paiute | 0.0 /100 | #320 | Tragic 51.5% |
| Dutch West Indians | 0.0 /100 | #321 | Tragic 51.5% |
| Comanche | 0.0 /100 | #322 | Tragic 51.7% |