Crow vs Dominican Disability Age Over 75
COMPARE
Crow
Dominican
Disability Age Over 75
Disability Age Over 75 Comparison
Crow
Dominicans
49.6%
DISABILITY AGE OVER 75
0.0/ 100
METRIC RATING
285th/ 347
METRIC RANK
50.2%
DISABILITY AGE OVER 75
0.0/ 100
METRIC RATING
301st/ 347
METRIC RANK
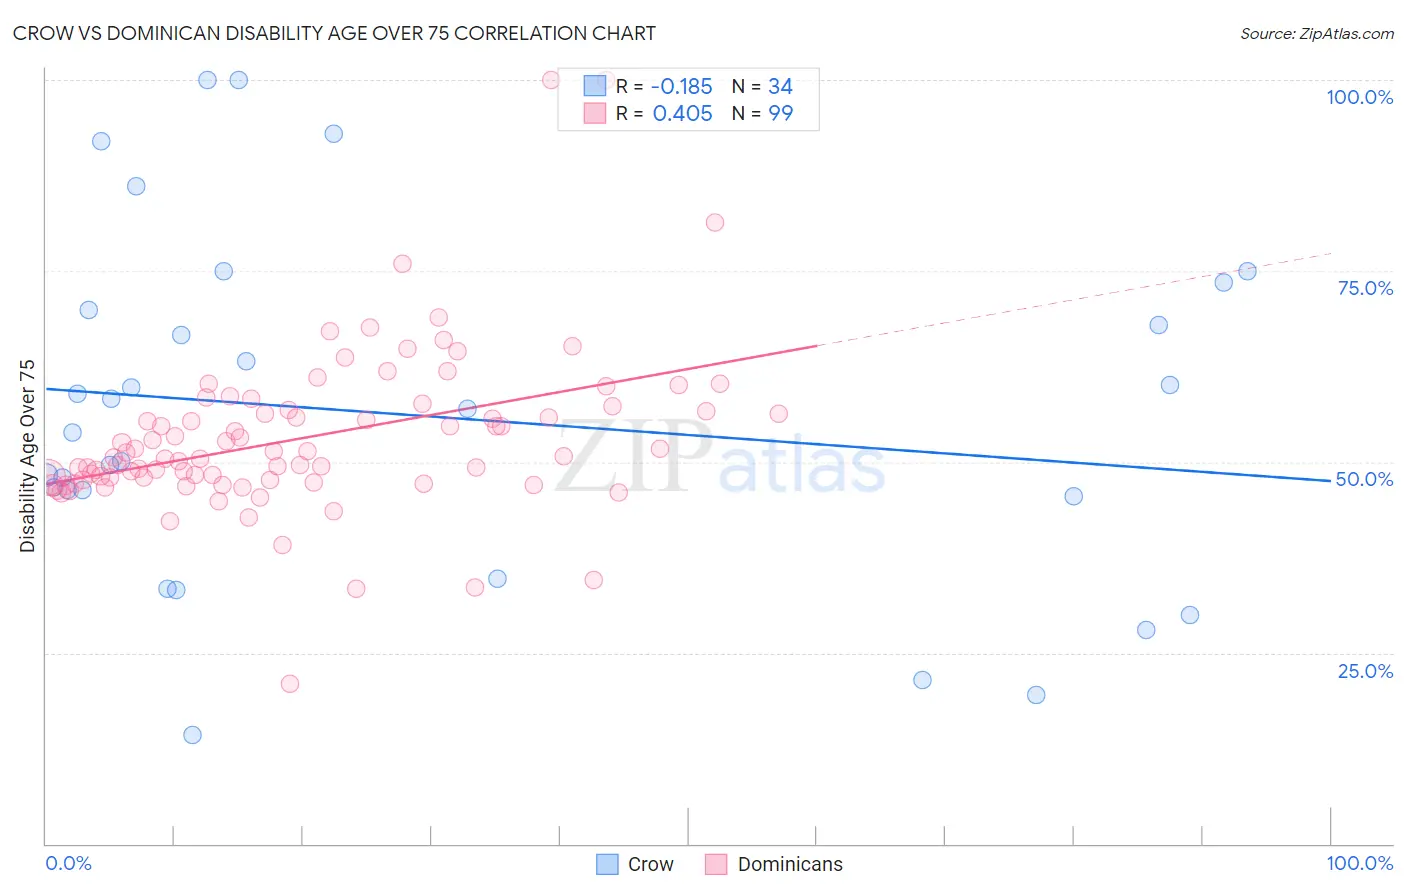
Crow vs Dominican Disability Age Over 75 Correlation Chart
The statistical analysis conducted on geographies consisting of 59,157,590 people shows a poor negative correlation between the proportion of Crow and percentage of population with a disability over the age of 75 in the United States with a correlation coefficient (R) of -0.185 and weighted average of 49.6%. Similarly, the statistical analysis conducted on geographies consisting of 354,096,183 people shows a moderate positive correlation between the proportion of Dominicans and percentage of population with a disability over the age of 75 in the United States with a correlation coefficient (R) of 0.405 and weighted average of 50.2%, a difference of 1.1%.
Disability Age Over 75 Correlation Summary
| Measurement | Crow | Dominican |
| Minimum | 14.3% | 21.0% |
| Maximum | 100.0% | 100.0% |
| Range | 85.7% | 79.0% |
| Mean | 56.0% | 53.2% |
| Median | 55.4% | 50.8% |
| Interquartile 25% (IQ1) | 45.5% | 47.6% |
| Interquartile 75% (IQ3) | 69.9% | 56.8% |
| Interquartile Range (IQR) | 24.4% | 9.2% |
| Standard Deviation (Sample) | 22.6% | 10.8% |
| Standard Deviation (Population) | 22.2% | 10.8% |
Demographics Similar to Crow and Dominicans by Disability Age Over 75
In terms of disability age over 75, the demographic groups most similar to Crow are Immigrants from Belize (49.6%, a difference of 0.080%), Immigrants from Latin America (49.5%, a difference of 0.13%), Samoan (49.5%, a difference of 0.19%), Sioux (49.7%, a difference of 0.29%), and Yaqui (49.8%, a difference of 0.34%). Similarly, the demographic groups most similar to Dominicans are Cape Verdean (50.1%, a difference of 0.060%), Immigrants from Micronesia (50.1%, a difference of 0.090%), Cherokee (50.2%, a difference of 0.15%), Marshallese (50.1%, a difference of 0.16%), and Japanese (50.2%, a difference of 0.17%).
| Demographics | Rating | Rank | Disability Age Over 75 |
| Samoans | 0.0 /100 | #283 | Tragic 49.5% |
| Immigrants | Latin America | 0.0 /100 | #284 | Tragic 49.5% |
| Crow | 0.0 /100 | #285 | Tragic 49.6% |
| Immigrants | Belize | 0.0 /100 | #286 | Tragic 49.6% |
| Sioux | 0.0 /100 | #287 | Tragic 49.7% |
| Yaqui | 0.0 /100 | #288 | Tragic 49.8% |
| Osage | 0.0 /100 | #289 | Tragic 49.8% |
| Puget Sound Salish | 0.0 /100 | #290 | Tragic 49.8% |
| Arapaho | 0.0 /100 | #291 | Tragic 49.8% |
| Shoshone | 0.0 /100 | #292 | Tragic 49.9% |
| Spanish American Indians | 0.0 /100 | #293 | Tragic 49.9% |
| Immigrants | Cambodia | 0.0 /100 | #294 | Tragic 50.0% |
| Spanish Americans | 0.0 /100 | #295 | Tragic 50.0% |
| Mexican American Indians | 0.0 /100 | #296 | Tragic 50.0% |
| Armenians | 0.0 /100 | #297 | Tragic 50.0% |
| Marshallese | 0.0 /100 | #298 | Tragic 50.1% |
| Immigrants | Micronesia | 0.0 /100 | #299 | Tragic 50.1% |
| Cape Verdeans | 0.0 /100 | #300 | Tragic 50.1% |
| Dominicans | 0.0 /100 | #301 | Tragic 50.2% |
| Cherokee | 0.0 /100 | #302 | Tragic 50.2% |
| Japanese | 0.0 /100 | #303 | Tragic 50.2% |