Crow vs French American Indian Disability Age Over 75
COMPARE
Crow
French American Indian
Disability Age Over 75
Disability Age Over 75 Comparison
Crow
French American Indians
49.6%
DISABILITY AGE OVER 75
0.0/ 100
METRIC RATING
285th/ 347
METRIC RANK
48.3%
DISABILITY AGE OVER 75
2.2/ 100
METRIC RATING
242nd/ 347
METRIC RANK
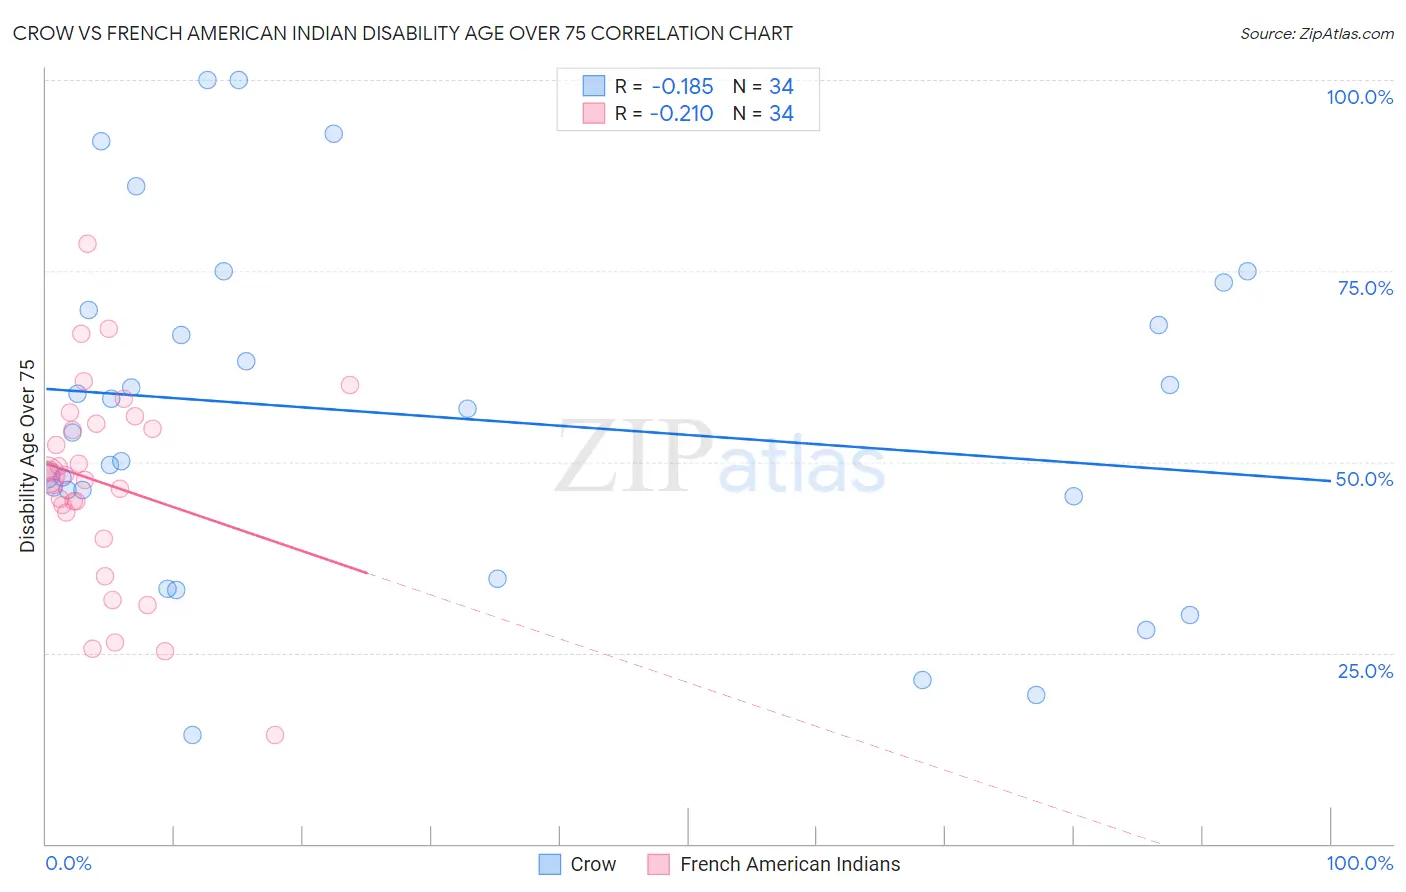
Crow vs French American Indian Disability Age Over 75 Correlation Chart
The statistical analysis conducted on geographies consisting of 59,157,590 people shows a poor negative correlation between the proportion of Crow and percentage of population with a disability over the age of 75 in the United States with a correlation coefficient (R) of -0.185 and weighted average of 49.6%. Similarly, the statistical analysis conducted on geographies consisting of 131,956,018 people shows a weak negative correlation between the proportion of French American Indians and percentage of population with a disability over the age of 75 in the United States with a correlation coefficient (R) of -0.210 and weighted average of 48.3%, a difference of 2.6%.
Disability Age Over 75 Correlation Summary
| Measurement | Crow | French American Indian |
| Minimum | 14.3% | 14.3% |
| Maximum | 100.0% | 78.6% |
| Range | 85.7% | 64.3% |
| Mean | 56.0% | 47.3% |
| Median | 55.4% | 48.2% |
| Interquartile 25% (IQ1) | 45.5% | 43.4% |
| Interquartile 75% (IQ3) | 69.9% | 55.0% |
| Interquartile Range (IQR) | 24.4% | 11.6% |
| Standard Deviation (Sample) | 22.6% | 13.3% |
| Standard Deviation (Population) | 22.2% | 13.1% |
Similar Demographics by Disability Age Over 75
Demographics Similar to Crow by Disability Age Over 75
In terms of disability age over 75, the demographic groups most similar to Crow are Immigrants from Belize (49.6%, a difference of 0.080%), Immigrants from Latin America (49.5%, a difference of 0.13%), Samoan (49.5%, a difference of 0.19%), Black/African American (49.5%, a difference of 0.21%), and Sioux (49.7%, a difference of 0.29%).
| Demographics | Rating | Rank | Disability Age Over 75 |
| Immigrants | Laos | 0.1 /100 | #278 | Tragic 49.2% |
| Guamanians/Chamorros | 0.0 /100 | #279 | Tragic 49.4% |
| Bangladeshis | 0.0 /100 | #280 | Tragic 49.4% |
| Belizeans | 0.0 /100 | #281 | Tragic 49.4% |
| Blacks/African Americans | 0.0 /100 | #282 | Tragic 49.5% |
| Samoans | 0.0 /100 | #283 | Tragic 49.5% |
| Immigrants | Latin America | 0.0 /100 | #284 | Tragic 49.5% |
| Crow | 0.0 /100 | #285 | Tragic 49.6% |
| Immigrants | Belize | 0.0 /100 | #286 | Tragic 49.6% |
| Sioux | 0.0 /100 | #287 | Tragic 49.7% |
| Yaqui | 0.0 /100 | #288 | Tragic 49.8% |
| Osage | 0.0 /100 | #289 | Tragic 49.8% |
| Puget Sound Salish | 0.0 /100 | #290 | Tragic 49.8% |
| Arapaho | 0.0 /100 | #291 | Tragic 49.8% |
| Shoshone | 0.0 /100 | #292 | Tragic 49.9% |
Demographics Similar to French American Indians by Disability Age Over 75
In terms of disability age over 75, the demographic groups most similar to French American Indians are Native Hawaiian (48.3%, a difference of 0.0%), Tongan (48.3%, a difference of 0.010%), Immigrants from Caribbean (48.4%, a difference of 0.040%), Immigrants from Thailand (48.3%, a difference of 0.12%), and Afghan (48.4%, a difference of 0.13%).
| Demographics | Rating | Rank | Disability Age Over 75 |
| Hmong | 3.8 /100 | #235 | Tragic 48.2% |
| Immigrants | Nicaragua | 3.2 /100 | #236 | Tragic 48.2% |
| Immigrants | St. Vincent and the Grenadines | 3.2 /100 | #237 | Tragic 48.2% |
| Nicaraguans | 3.0 /100 | #238 | Tragic 48.3% |
| Immigrants | Thailand | 2.8 /100 | #239 | Tragic 48.3% |
| Tongans | 2.3 /100 | #240 | Tragic 48.3% |
| Native Hawaiians | 2.2 /100 | #241 | Tragic 48.3% |
| French American Indians | 2.2 /100 | #242 | Tragic 48.3% |
| Immigrants | Caribbean | 2.1 /100 | #243 | Tragic 48.4% |
| Afghans | 1.8 /100 | #244 | Tragic 48.4% |
| Americans | 1.7 /100 | #245 | Tragic 48.4% |
| Chippewa | 1.6 /100 | #246 | Tragic 48.4% |
| Iroquois | 1.6 /100 | #247 | Tragic 48.4% |
| Sri Lankans | 1.4 /100 | #248 | Tragic 48.5% |
| Iraqis | 1.0 /100 | #249 | Tragic 48.6% |