Crow vs Immigrants from Somalia In Labor Force | Age 35-44
COMPARE
Crow
Immigrants from Somalia
In Labor Force | Age 35-44
In Labor Force | Age 35-44 Comparison
Crow
Immigrants from Somalia
76.5%
IN LABOR FORCE | AGE 35-44
0.0/ 100
METRIC RATING
342nd/ 347
METRIC RANK
85.6%
IN LABOR FORCE | AGE 35-44
100.0/ 100
METRIC RATING
14th/ 347
METRIC RANK
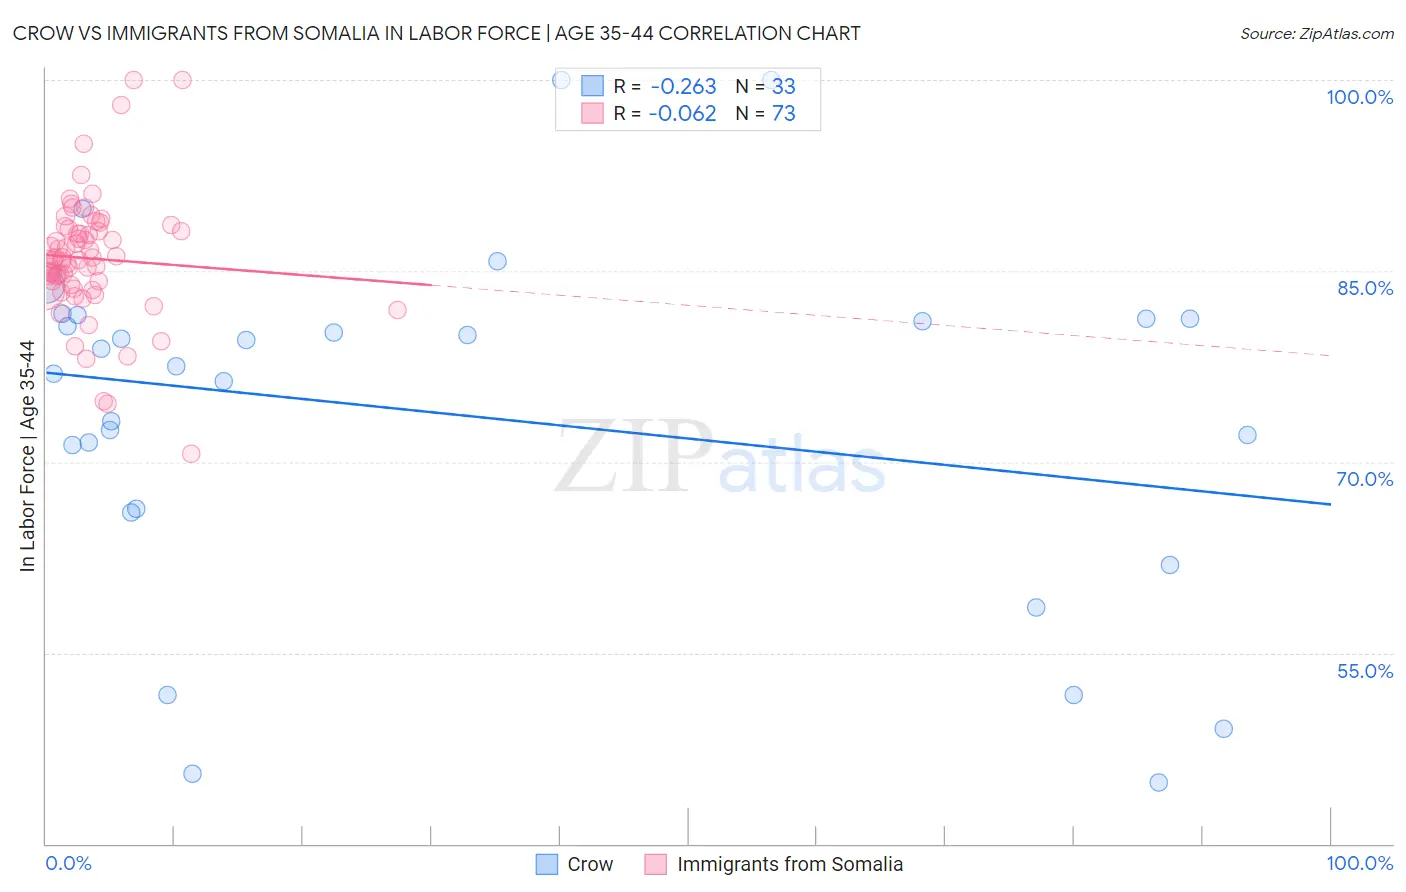
Crow vs Immigrants from Somalia In Labor Force | Age 35-44 Correlation Chart
The statistical analysis conducted on geographies consisting of 59,203,042 people shows a weak negative correlation between the proportion of Crow and labor force participation rate among population between the ages 35 and 44 in the United States with a correlation coefficient (R) of -0.263 and weighted average of 76.5%. Similarly, the statistical analysis conducted on geographies consisting of 92,101,843 people shows a slight negative correlation between the proportion of Immigrants from Somalia and labor force participation rate among population between the ages 35 and 44 in the United States with a correlation coefficient (R) of -0.062 and weighted average of 85.6%, a difference of 12.0%.
In Labor Force | Age 35-44 Correlation Summary
| Measurement | Crow | Immigrants from Somalia |
| Minimum | 44.8% | 70.6% |
| Maximum | 100.0% | 100.0% |
| Range | 55.2% | 29.4% |
| Mean | 73.7% | 86.0% |
| Median | 77.5% | 85.9% |
| Interquartile 25% (IQ1) | 66.2% | 83.8% |
| Interquartile 75% (IQ3) | 81.2% | 88.2% |
| Interquartile Range (IQR) | 15.0% | 4.4% |
| Standard Deviation (Sample) | 13.9% | 4.9% |
| Standard Deviation (Population) | 13.7% | 4.8% |
Similar Demographics by In Labor Force | Age 35-44
Demographics Similar to Crow by In Labor Force | Age 35-44
In terms of in labor force | age 35-44, the demographic groups most similar to Crow are Immigrants from Yemen (76.3%, a difference of 0.24%), Hopi (77.0%, a difference of 0.64%), Lumbee (77.0%, a difference of 0.69%), Yup'ik (77.3%, a difference of 1.0%), and Pueblo (77.4%, a difference of 1.1%).
| Demographics | Rating | Rank | In Labor Force | Age 35-44 |
| Kiowa | 0.0 /100 | #333 | Tragic 79.2% |
| Yakama | 0.0 /100 | #334 | Tragic 79.0% |
| Natives/Alaskans | 0.0 /100 | #335 | Tragic 78.9% |
| Arapaho | 0.0 /100 | #336 | Tragic 78.1% |
| Apache | 0.0 /100 | #337 | Tragic 77.9% |
| Pueblo | 0.0 /100 | #338 | Tragic 77.4% |
| Yup'ik | 0.0 /100 | #339 | Tragic 77.3% |
| Lumbee | 0.0 /100 | #340 | Tragic 77.0% |
| Hopi | 0.0 /100 | #341 | Tragic 77.0% |
| Crow | 0.0 /100 | #342 | Tragic 76.5% |
| Immigrants | Yemen | 0.0 /100 | #343 | Tragic 76.3% |
| Pima | 0.0 /100 | #344 | Tragic 74.8% |
| Yuman | 0.0 /100 | #345 | Tragic 74.7% |
| Tohono O'odham | 0.0 /100 | #346 | Tragic 74.1% |
| Navajo | 0.0 /100 | #347 | Tragic 73.8% |
Demographics Similar to Immigrants from Somalia by In Labor Force | Age 35-44
In terms of in labor force | age 35-44, the demographic groups most similar to Immigrants from Somalia are Somali (85.6%, a difference of 0.0%), Liberian (85.7%, a difference of 0.020%), Norwegian (85.6%, a difference of 0.040%), Immigrants from Ireland (85.6%, a difference of 0.040%), and Immigrants from North Macedonia (85.6%, a difference of 0.090%).
| Demographics | Rating | Rank | In Labor Force | Age 35-44 |
| Immigrants | Sierra Leone | 100.0 /100 | #7 | Exceptional 86.1% |
| Immigrants | Ethiopia | 100.0 /100 | #8 | Exceptional 85.9% |
| Ethiopians | 100.0 /100 | #9 | Exceptional 85.9% |
| Cape Verdeans | 100.0 /100 | #10 | Exceptional 85.8% |
| Immigrants | Cameroon | 100.0 /100 | #11 | Exceptional 85.8% |
| Liberians | 100.0 /100 | #12 | Exceptional 85.7% |
| Somalis | 100.0 /100 | #13 | Exceptional 85.6% |
| Immigrants | Somalia | 100.0 /100 | #14 | Exceptional 85.6% |
| Norwegians | 100.0 /100 | #15 | Exceptional 85.6% |
| Immigrants | Ireland | 100.0 /100 | #16 | Exceptional 85.6% |
| Immigrants | North Macedonia | 100.0 /100 | #17 | Exceptional 85.6% |
| Carpatho Rusyns | 100.0 /100 | #18 | Exceptional 85.6% |
| Slovenes | 100.0 /100 | #19 | Exceptional 85.6% |
| Immigrants | Serbia | 100.0 /100 | #20 | Exceptional 85.5% |
| Bulgarians | 100.0 /100 | #21 | Exceptional 85.5% |