Crow vs Okinawan Vision Disability
COMPARE
Crow
Okinawan
Vision Disability
Vision Disability Comparison
Crow
Okinawans
2.5%
VISION DISABILITY
0.0/ 100
METRIC RATING
292nd/ 347
METRIC RANK
1.8%
VISION DISABILITY
100.0/ 100
METRIC RATING
5th/ 347
METRIC RANK
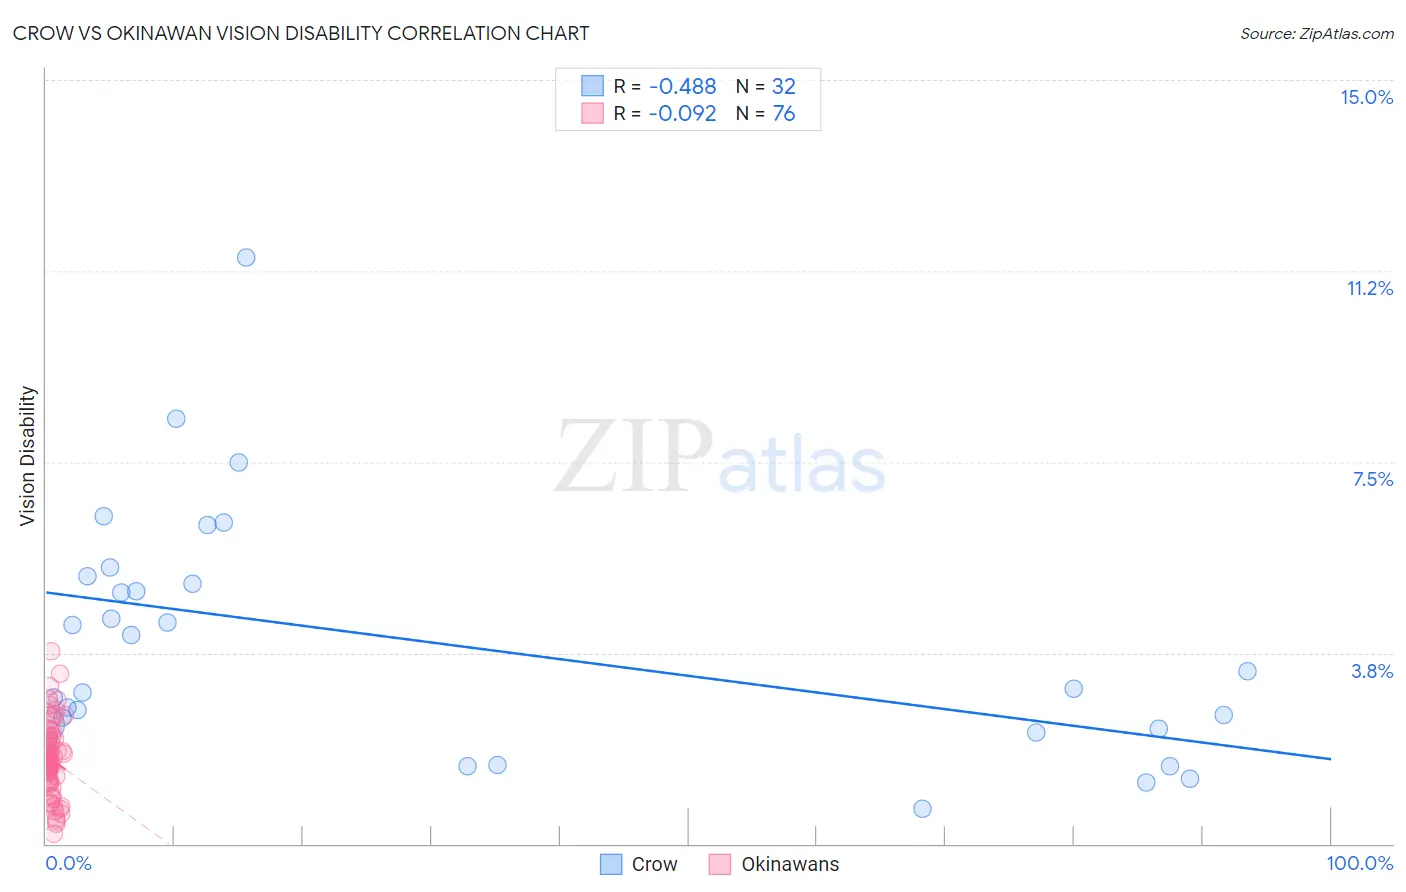
Crow vs Okinawan Vision Disability Correlation Chart
The statistical analysis conducted on geographies consisting of 59,186,790 people shows a moderate negative correlation between the proportion of Crow and percentage of population with vision disability in the United States with a correlation coefficient (R) of -0.488 and weighted average of 2.5%. Similarly, the statistical analysis conducted on geographies consisting of 73,755,744 people shows a slight negative correlation between the proportion of Okinawans and percentage of population with vision disability in the United States with a correlation coefficient (R) of -0.092 and weighted average of 1.8%, a difference of 40.7%.
Vision Disability Correlation Summary
| Measurement | Crow | Okinawan |
| Minimum | 0.69% | 0.19% |
| Maximum | 11.5% | 3.8% |
| Range | 10.8% | 3.6% |
| Mean | 3.9% | 1.7% |
| Median | 3.2% | 1.6% |
| Interquartile 25% (IQ1) | 2.3% | 1.2% |
| Interquartile 75% (IQ3) | 5.2% | 2.0% |
| Interquartile Range (IQR) | 2.9% | 0.80% |
| Standard Deviation (Sample) | 2.4% | 0.69% |
| Standard Deviation (Population) | 2.3% | 0.69% |
Similar Demographics by Vision Disability
Demographics Similar to Crow by Vision Disability
In terms of vision disability, the demographic groups most similar to Crow are Yaqui (2.5%, a difference of 0.030%), Immigrants from Honduras (2.5%, a difference of 0.10%), Ottawa (2.5%, a difference of 0.36%), Immigrants from Cuba (2.5%, a difference of 0.49%), and Delaware (2.5%, a difference of 0.58%).
| Demographics | Rating | Rank | Vision Disability |
| Immigrants | Central America | 0.0 /100 | #285 | Tragic 2.5% |
| Sioux | 0.0 /100 | #286 | Tragic 2.5% |
| Hondurans | 0.0 /100 | #287 | Tragic 2.5% |
| French American Indians | 0.0 /100 | #288 | Tragic 2.5% |
| Immigrants | Nonimmigrants | 0.0 /100 | #289 | Tragic 2.5% |
| Immigrants | Cuba | 0.0 /100 | #290 | Tragic 2.5% |
| Immigrants | Honduras | 0.0 /100 | #291 | Tragic 2.5% |
| Crow | 0.0 /100 | #292 | Tragic 2.5% |
| Yaqui | 0.0 /100 | #293 | Tragic 2.5% |
| Ottawa | 0.0 /100 | #294 | Tragic 2.5% |
| Delaware | 0.0 /100 | #295 | Tragic 2.5% |
| Immigrants | Mexico | 0.0 /100 | #296 | Tragic 2.5% |
| Immigrants | Dominica | 0.0 /100 | #297 | Tragic 2.5% |
| Mexicans | 0.0 /100 | #298 | Tragic 2.5% |
| Cree | 0.0 /100 | #299 | Tragic 2.5% |
Demographics Similar to Okinawans by Vision Disability
In terms of vision disability, the demographic groups most similar to Okinawans are Immigrants from Iran (1.8%, a difference of 0.59%), Immigrants from South Central Asia (1.8%, a difference of 0.65%), Iranian (1.8%, a difference of 0.80%), Immigrants from Singapore (1.8%, a difference of 1.5%), and Immigrants from Hong Kong (1.8%, a difference of 1.7%).
| Demographics | Rating | Rank | Vision Disability |
| Immigrants | India | 100.0 /100 | #1 | Exceptional 1.7% |
| Filipinos | 100.0 /100 | #2 | Exceptional 1.7% |
| Immigrants | Taiwan | 100.0 /100 | #3 | Exceptional 1.7% |
| Thais | 100.0 /100 | #4 | Exceptional 1.7% |
| Okinawans | 100.0 /100 | #5 | Exceptional 1.8% |
| Immigrants | Iran | 100.0 /100 | #6 | Exceptional 1.8% |
| Immigrants | South Central Asia | 100.0 /100 | #7 | Exceptional 1.8% |
| Iranians | 100.0 /100 | #8 | Exceptional 1.8% |
| Immigrants | Singapore | 100.0 /100 | #9 | Exceptional 1.8% |
| Immigrants | Hong Kong | 100.0 /100 | #10 | Exceptional 1.8% |
| Immigrants | Israel | 100.0 /100 | #11 | Exceptional 1.8% |
| Immigrants | Korea | 100.0 /100 | #12 | Exceptional 1.8% |
| Immigrants | Eastern Asia | 100.0 /100 | #13 | Exceptional 1.8% |
| Immigrants | China | 100.0 /100 | #14 | Exceptional 1.8% |
| Immigrants | Bolivia | 100.0 /100 | #15 | Exceptional 1.8% |