Crow vs Serbian Vision Disability
COMPARE
Crow
Serbian
Vision Disability
Vision Disability Comparison
Crow
Serbians
2.5%
VISION DISABILITY
0.0/ 100
METRIC RATING
292nd/ 347
METRIC RANK
2.1%
VISION DISABILITY
70.2/ 100
METRIC RATING
157th/ 347
METRIC RANK
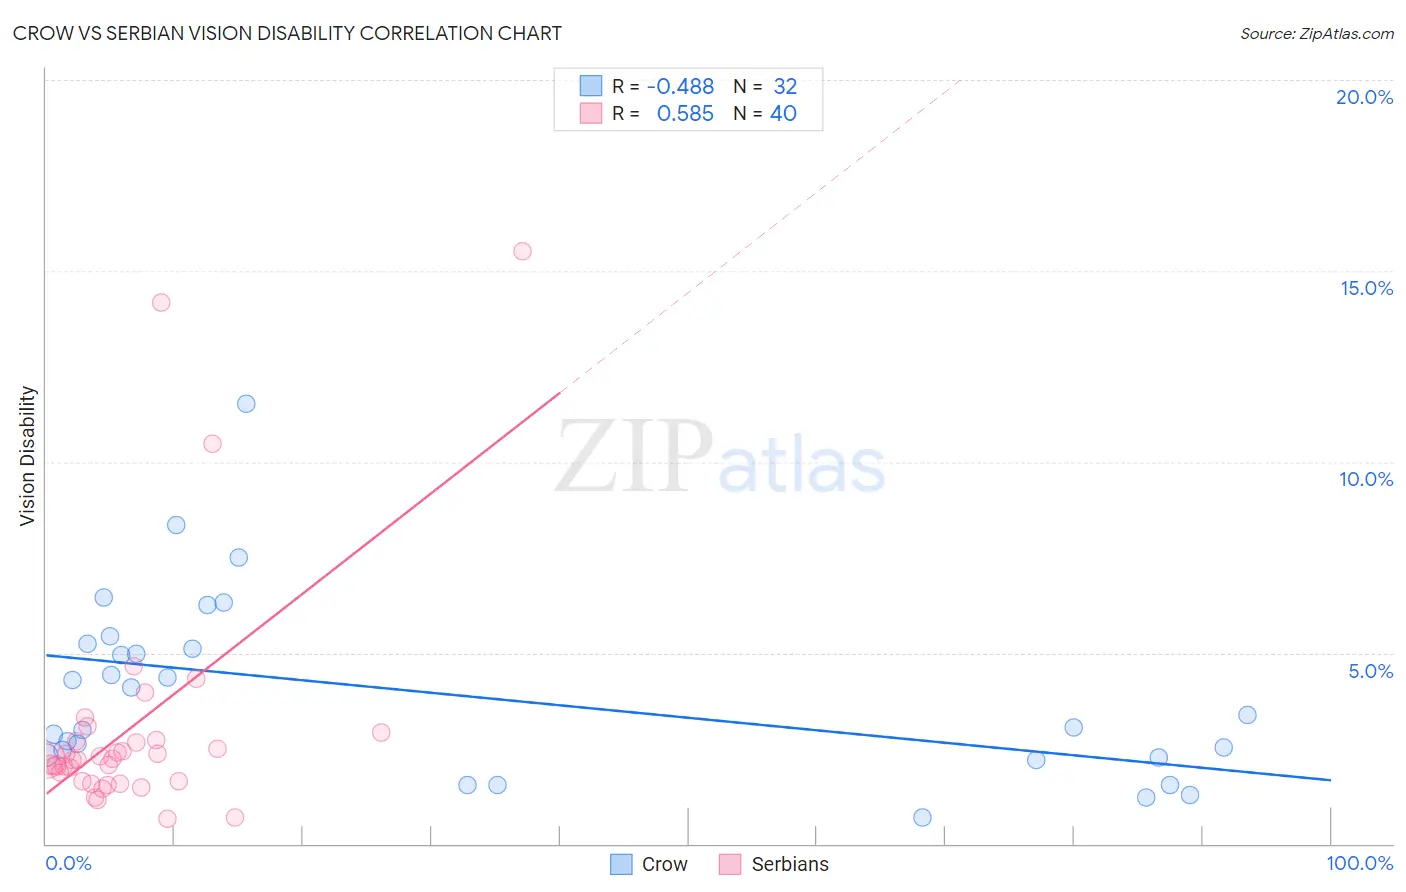
Crow vs Serbian Vision Disability Correlation Chart
The statistical analysis conducted on geographies consisting of 59,186,790 people shows a moderate negative correlation between the proportion of Crow and percentage of population with vision disability in the United States with a correlation coefficient (R) of -0.488 and weighted average of 2.5%. Similarly, the statistical analysis conducted on geographies consisting of 267,561,592 people shows a substantial positive correlation between the proportion of Serbians and percentage of population with vision disability in the United States with a correlation coefficient (R) of 0.585 and weighted average of 2.1%, a difference of 16.8%.
Vision Disability Correlation Summary
| Measurement | Crow | Serbian |
| Minimum | 0.69% | 0.66% |
| Maximum | 11.5% | 15.5% |
| Range | 10.8% | 14.8% |
| Mean | 3.9% | 3.1% |
| Median | 3.2% | 2.2% |
| Interquartile 25% (IQ1) | 2.3% | 1.6% |
| Interquartile 75% (IQ3) | 5.2% | 2.7% |
| Interquartile Range (IQR) | 2.9% | 1.1% |
| Standard Deviation (Sample) | 2.4% | 3.1% |
| Standard Deviation (Population) | 2.3% | 3.1% |
Similar Demographics by Vision Disability
Demographics Similar to Crow by Vision Disability
In terms of vision disability, the demographic groups most similar to Crow are Yaqui (2.5%, a difference of 0.030%), Immigrants from Honduras (2.5%, a difference of 0.10%), Ottawa (2.5%, a difference of 0.36%), Immigrants from Cuba (2.5%, a difference of 0.49%), and Delaware (2.5%, a difference of 0.58%).
| Demographics | Rating | Rank | Vision Disability |
| Immigrants | Central America | 0.0 /100 | #285 | Tragic 2.5% |
| Sioux | 0.0 /100 | #286 | Tragic 2.5% |
| Hondurans | 0.0 /100 | #287 | Tragic 2.5% |
| French American Indians | 0.0 /100 | #288 | Tragic 2.5% |
| Immigrants | Nonimmigrants | 0.0 /100 | #289 | Tragic 2.5% |
| Immigrants | Cuba | 0.0 /100 | #290 | Tragic 2.5% |
| Immigrants | Honduras | 0.0 /100 | #291 | Tragic 2.5% |
| Crow | 0.0 /100 | #292 | Tragic 2.5% |
| Yaqui | 0.0 /100 | #293 | Tragic 2.5% |
| Ottawa | 0.0 /100 | #294 | Tragic 2.5% |
| Delaware | 0.0 /100 | #295 | Tragic 2.5% |
| Immigrants | Mexico | 0.0 /100 | #296 | Tragic 2.5% |
| Immigrants | Dominica | 0.0 /100 | #297 | Tragic 2.5% |
| Mexicans | 0.0 /100 | #298 | Tragic 2.5% |
| Cree | 0.0 /100 | #299 | Tragic 2.5% |
Demographics Similar to Serbians by Vision Disability
In terms of vision disability, the demographic groups most similar to Serbians are Immigrants from Uzbekistan (2.1%, a difference of 0.030%), South African (2.1%, a difference of 0.030%), Austrian (2.1%, a difference of 0.090%), Pakistani (2.1%, a difference of 0.11%), and Immigrants from Colombia (2.1%, a difference of 0.14%).
| Demographics | Rating | Rank | Vision Disability |
| Belgians | 75.9 /100 | #150 | Good 2.1% |
| Immigrants | Norway | 75.5 /100 | #151 | Good 2.1% |
| Immigrants | Southern Europe | 74.6 /100 | #152 | Good 2.1% |
| Immigrants | South America | 73.8 /100 | #153 | Good 2.1% |
| Slovenes | 73.6 /100 | #154 | Good 2.1% |
| Immigrants | Colombia | 72.1 /100 | #155 | Good 2.1% |
| Pakistanis | 71.6 /100 | #156 | Good 2.1% |
| Serbians | 70.2 /100 | #157 | Good 2.1% |
| Immigrants | Uzbekistan | 69.9 /100 | #158 | Good 2.1% |
| South Africans | 69.8 /100 | #159 | Good 2.1% |
| Austrians | 69.0 /100 | #160 | Good 2.1% |
| Iraqis | 67.7 /100 | #161 | Good 2.1% |
| Hungarians | 67.4 /100 | #162 | Good 2.1% |
| Icelanders | 66.1 /100 | #163 | Good 2.1% |
| Immigrants | Bangladesh | 65.5 /100 | #164 | Good 2.1% |