Blackfeet vs Immigrants from Ghana Disability Age 65 to 74
COMPARE
Blackfeet
Immigrants from Ghana
Disability Age 65 to 74
Disability Age 65 to 74 Comparison
Blackfeet
Immigrants from Ghana
26.6%
DISABILITY AGE 65 TO 74
0.0/ 100
METRIC RATING
292nd/ 347
METRIC RANK
24.5%
DISABILITY AGE 65 TO 74
3.0/ 100
METRIC RATING
238th/ 347
METRIC RANK
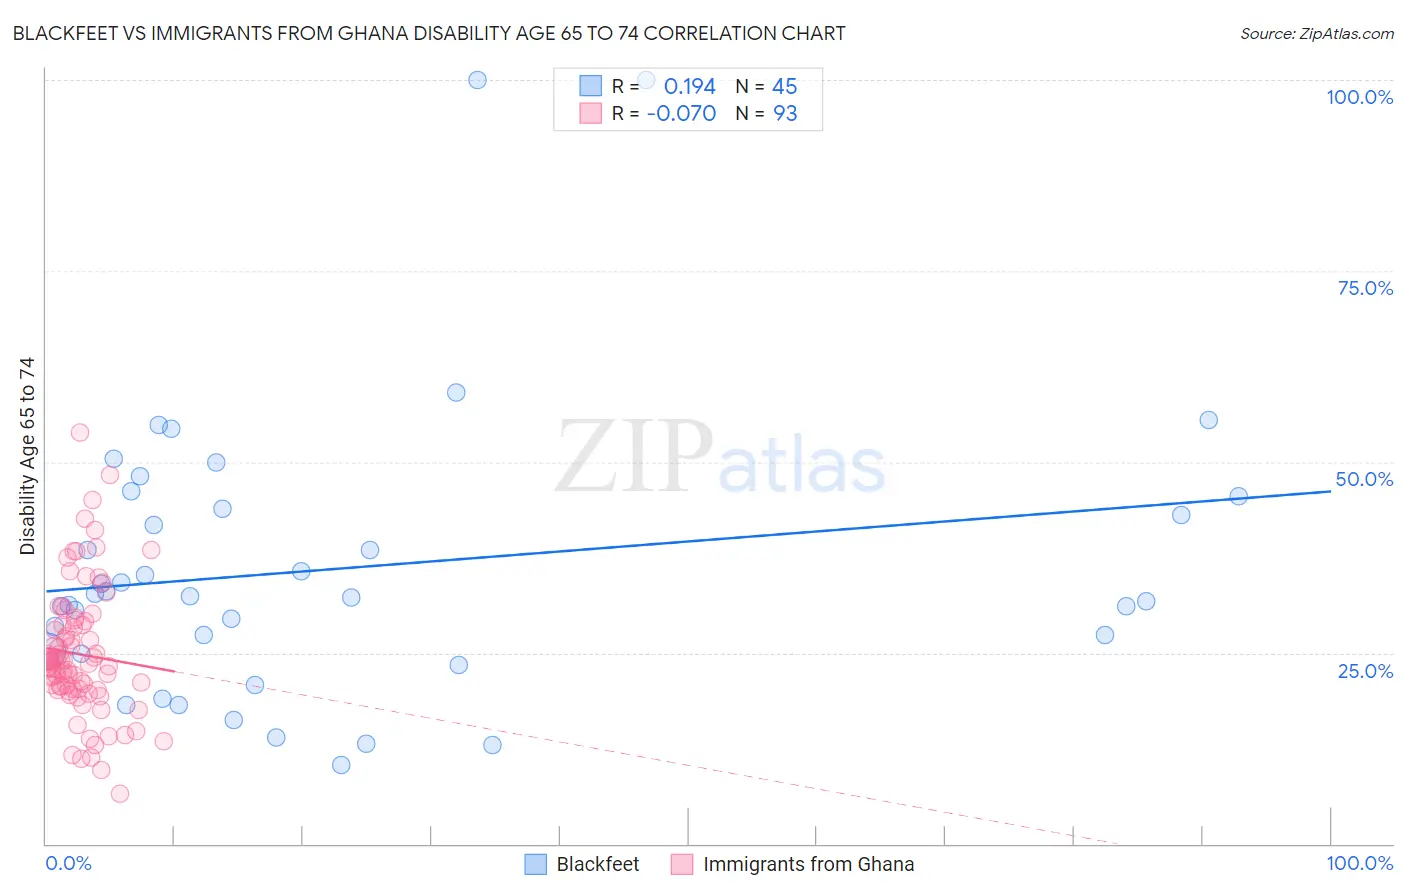
Blackfeet vs Immigrants from Ghana Disability Age 65 to 74 Correlation Chart
The statistical analysis conducted on geographies consisting of 309,087,362 people shows a poor positive correlation between the proportion of Blackfeet and percentage of population with a disability between the ages 65 and 75 in the United States with a correlation coefficient (R) of 0.194 and weighted average of 26.6%. Similarly, the statistical analysis conducted on geographies consisting of 199,556,575 people shows a slight negative correlation between the proportion of Immigrants from Ghana and percentage of population with a disability between the ages 65 and 75 in the United States with a correlation coefficient (R) of -0.070 and weighted average of 24.5%, a difference of 8.5%.
Disability Age 65 to 74 Correlation Summary
| Measurement | Blackfeet | Immigrants from Ghana |
| Minimum | 10.2% | 6.5% |
| Maximum | 100.0% | 53.8% |
| Range | 89.8% | 47.4% |
| Mean | 36.1% | 24.8% |
| Median | 32.3% | 23.8% |
| Interquartile 25% (IQ1) | 25.1% | 20.3% |
| Interquartile 75% (IQ3) | 44.6% | 28.6% |
| Interquartile Range (IQR) | 19.6% | 8.3% |
| Standard Deviation (Sample) | 18.6% | 8.4% |
| Standard Deviation (Population) | 18.4% | 8.4% |
Similar Demographics by Disability Age 65 to 74
Demographics Similar to Blackfeet by Disability Age 65 to 74
In terms of disability age 65 to 74, the demographic groups most similar to Blackfeet are Immigrants from Central America (26.6%, a difference of 0.16%), Dominican (26.7%, a difference of 0.28%), Hispanic or Latino (26.7%, a difference of 0.30%), Spanish American Indian (26.4%, a difference of 0.88%), and Bangladeshi (26.8%, a difference of 0.91%).
| Demographics | Rating | Rank | Disability Age 65 to 74 |
| Immigrants | Congo | 0.0 /100 | #285 | Tragic 26.0% |
| Immigrants | Micronesia | 0.0 /100 | #286 | Tragic 26.1% |
| Immigrants | Laos | 0.0 /100 | #287 | Tragic 26.1% |
| Mexican American Indians | 0.0 /100 | #288 | Tragic 26.2% |
| Africans | 0.0 /100 | #289 | Tragic 26.2% |
| Immigrants | Cabo Verde | 0.0 /100 | #290 | Tragic 26.3% |
| Spanish American Indians | 0.0 /100 | #291 | Tragic 26.4% |
| Blackfeet | 0.0 /100 | #292 | Tragic 26.6% |
| Immigrants | Central America | 0.0 /100 | #293 | Tragic 26.6% |
| Dominicans | 0.0 /100 | #294 | Tragic 26.7% |
| Hispanics or Latinos | 0.0 /100 | #295 | Tragic 26.7% |
| Bangladeshis | 0.0 /100 | #296 | Tragic 26.8% |
| Fijians | 0.0 /100 | #297 | Tragic 27.0% |
| Immigrants | Yemen | 0.0 /100 | #298 | Tragic 27.0% |
| Potawatomi | 0.0 /100 | #299 | Tragic 27.0% |
Demographics Similar to Immigrants from Ghana by Disability Age 65 to 74
In terms of disability age 65 to 74, the demographic groups most similar to Immigrants from Ghana are West Indian (24.5%, a difference of 0.17%), Immigrants from Caribbean (24.6%, a difference of 0.22%), German Russian (24.4%, a difference of 0.27%), Scotch-Irish (24.4%, a difference of 0.31%), and Spaniard (24.6%, a difference of 0.31%).
| Demographics | Rating | Rank | Disability Age 65 to 74 |
| Immigrants | Thailand | 5.2 /100 | #231 | Tragic 24.3% |
| Immigrants | Zaire | 5.0 /100 | #232 | Tragic 24.3% |
| Bahamians | 4.5 /100 | #233 | Tragic 24.4% |
| Panamanians | 4.2 /100 | #234 | Tragic 24.4% |
| Scotch-Irish | 3.8 /100 | #235 | Tragic 24.4% |
| German Russians | 3.7 /100 | #236 | Tragic 24.4% |
| West Indians | 3.4 /100 | #237 | Tragic 24.5% |
| Immigrants | Ghana | 3.0 /100 | #238 | Tragic 24.5% |
| Immigrants | Caribbean | 2.6 /100 | #239 | Tragic 24.6% |
| Spaniards | 2.4 /100 | #240 | Tragic 24.6% |
| Immigrants | Western Africa | 2.3 /100 | #241 | Tragic 24.6% |
| Immigrants | Senegal | 2.2 /100 | #242 | Tragic 24.6% |
| Spanish | 2.2 /100 | #243 | Tragic 24.6% |
| Armenians | 2.0 /100 | #244 | Tragic 24.7% |
| British West Indians | 2.0 /100 | #245 | Tragic 24.7% |