Crow vs Immigrants from Asia Female Poverty Among 25-34 Year Olds
COMPARE
Crow
Immigrants from Asia
Female Poverty Among 25-34 Year Olds
Female Poverty Among 25-34 Year Olds Comparison
Crow
Immigrants from Asia
22.7%
FEMALE POVERTY AMONG 25-34 YEAR OLDS
0.0/ 100
METRIC RATING
337th/ 347
METRIC RANK
11.6%
FEMALE POVERTY AMONG 25-34 YEAR OLDS
99.9/ 100
METRIC RATING
32nd/ 347
METRIC RANK
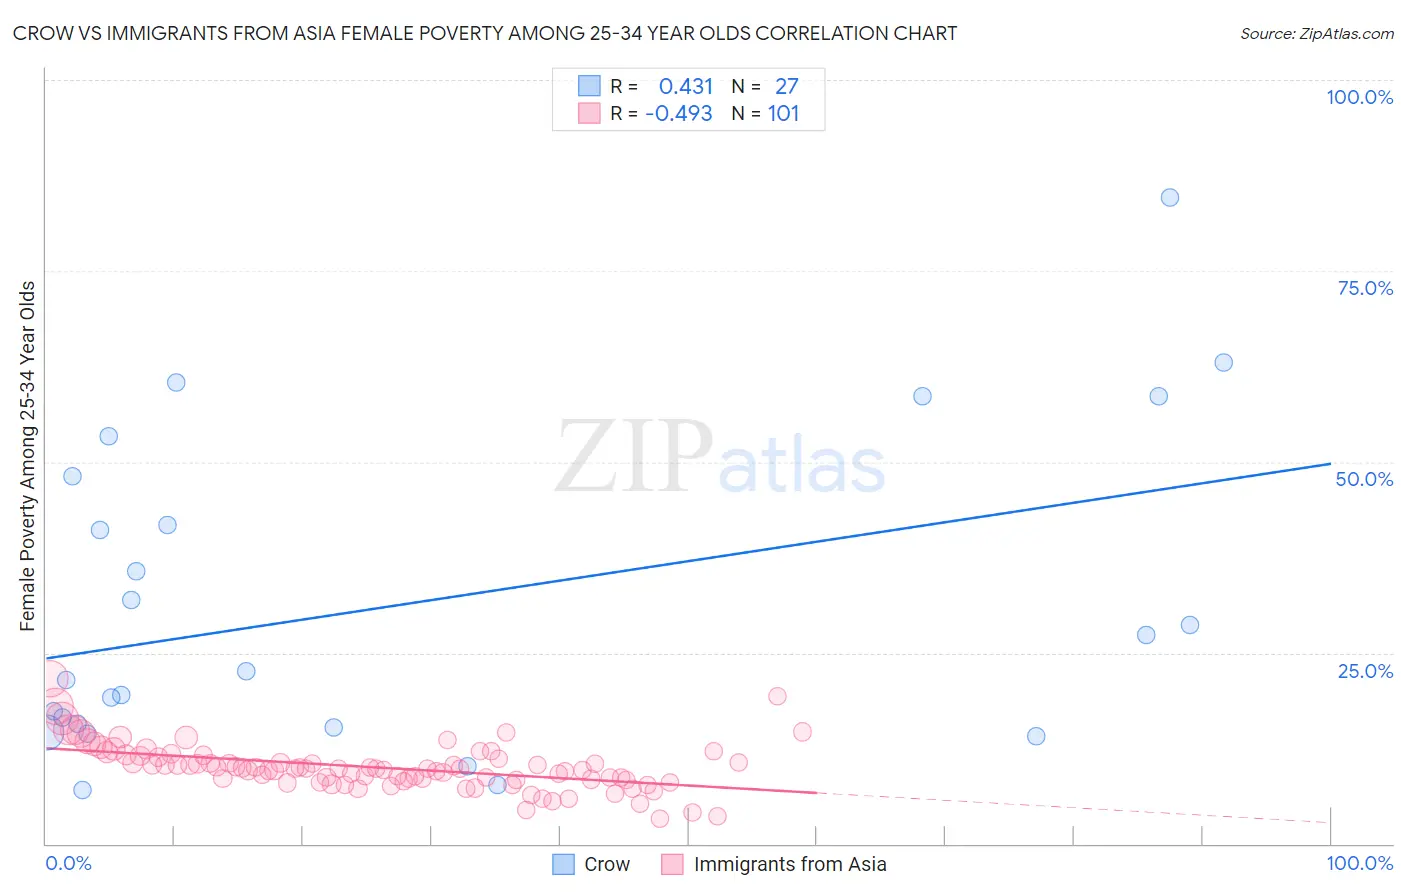
Crow vs Immigrants from Asia Female Poverty Among 25-34 Year Olds Correlation Chart
The statistical analysis conducted on geographies consisting of 59,005,346 people shows a moderate positive correlation between the proportion of Crow and poverty level among females between the ages 25 and 34 in the United States with a correlation coefficient (R) of 0.431 and weighted average of 22.7%. Similarly, the statistical analysis conducted on geographies consisting of 531,620,237 people shows a moderate negative correlation between the proportion of Immigrants from Asia and poverty level among females between the ages 25 and 34 in the United States with a correlation coefficient (R) of -0.493 and weighted average of 11.6%, a difference of 95.6%.
Female Poverty Among 25-34 Year Olds Correlation Summary
| Measurement | Crow | Immigrants from Asia |
| Minimum | 7.1% | 3.3% |
| Maximum | 84.6% | 21.5% |
| Range | 77.6% | 18.2% |
| Mean | 31.4% | 10.0% |
| Median | 22.7% | 9.8% |
| Interquartile 25% (IQ1) | 15.2% | 8.4% |
| Interquartile 75% (IQ3) | 48.1% | 11.4% |
| Interquartile Range (IQR) | 32.9% | 3.0% |
| Standard Deviation (Sample) | 20.6% | 3.0% |
| Standard Deviation (Population) | 20.2% | 3.0% |
Similar Demographics by Female Poverty Among 25-34 Year Olds
Demographics Similar to Crow by Female Poverty Among 25-34 Year Olds
In terms of female poverty among 25-34 year olds, the demographic groups most similar to Crow are Houma (22.7%, a difference of 0.17%), Yuman (22.9%, a difference of 1.0%), Sioux (23.0%, a difference of 1.2%), Pueblo (22.2%, a difference of 2.3%), and Navajo (23.3%, a difference of 2.9%).
| Demographics | Rating | Rank | Female Poverty Among 25-34 Year Olds |
| Paiute | 0.0 /100 | #330 | Tragic 19.6% |
| Kiowa | 0.0 /100 | #331 | Tragic 19.7% |
| Immigrants | Yemen | 0.0 /100 | #332 | Tragic 19.8% |
| Cajuns | 0.0 /100 | #333 | Tragic 19.9% |
| Apache | 0.0 /100 | #334 | Tragic 20.1% |
| Natives/Alaskans | 0.0 /100 | #335 | Tragic 20.3% |
| Pueblo | 0.0 /100 | #336 | Tragic 22.2% |
| Crow | 0.0 /100 | #337 | Tragic 22.7% |
| Houma | 0.0 /100 | #338 | Tragic 22.7% |
| Yuman | 0.0 /100 | #339 | Tragic 22.9% |
| Sioux | 0.0 /100 | #340 | Tragic 23.0% |
| Navajo | 0.0 /100 | #341 | Tragic 23.3% |
| Hopi | 0.0 /100 | #342 | Tragic 23.7% |
| Yup'ik | 0.0 /100 | #343 | Tragic 24.3% |
| Tohono O'odham | 0.0 /100 | #344 | Tragic 24.7% |
Demographics Similar to Immigrants from Asia by Female Poverty Among 25-34 Year Olds
In terms of female poverty among 25-34 year olds, the demographic groups most similar to Immigrants from Asia are Immigrants from Japan (11.6%, a difference of 0.30%), Immigrants from Poland (11.6%, a difference of 0.35%), Zimbabwean (11.7%, a difference of 0.57%), Cypriot (11.5%, a difference of 0.59%), and Immigrants from Pakistan (11.5%, a difference of 0.62%).
| Demographics | Rating | Rank | Female Poverty Among 25-34 Year Olds |
| Bhutanese | 99.9 /100 | #25 | Exceptional 11.4% |
| Tongans | 99.9 /100 | #26 | Exceptional 11.5% |
| Immigrants | Greece | 99.9 /100 | #27 | Exceptional 11.5% |
| Immigrants | Pakistan | 99.9 /100 | #28 | Exceptional 11.5% |
| Bulgarians | 99.9 /100 | #29 | Exceptional 11.5% |
| Cypriots | 99.9 /100 | #30 | Exceptional 11.5% |
| Immigrants | Japan | 99.9 /100 | #31 | Exceptional 11.6% |
| Immigrants | Asia | 99.9 /100 | #32 | Exceptional 11.6% |
| Immigrants | Poland | 99.9 /100 | #33 | Exceptional 11.6% |
| Zimbabweans | 99.9 /100 | #34 | Exceptional 11.7% |
| Cambodians | 99.9 /100 | #35 | Exceptional 11.7% |
| Immigrants | Sri Lanka | 99.8 /100 | #36 | Exceptional 11.8% |
| Taiwanese | 99.8 /100 | #37 | Exceptional 11.8% |
| Immigrants | North Macedonia | 99.8 /100 | #38 | Exceptional 11.8% |
| Latvians | 99.8 /100 | #39 | Exceptional 11.8% |