Creek vs Swiss Disability Age Under 5
COMPARE
Creek
Swiss
Disability Age Under 5
Disability Age Under 5 Comparison
Creek
Swiss
1.6%
DISABILITY AGE UNDER 5
0.0/ 100
METRIC RATING
306th/ 347
METRIC RANK
1.6%
DISABILITY AGE UNDER 5
0.0/ 100
METRIC RATING
303rd/ 347
METRIC RANK
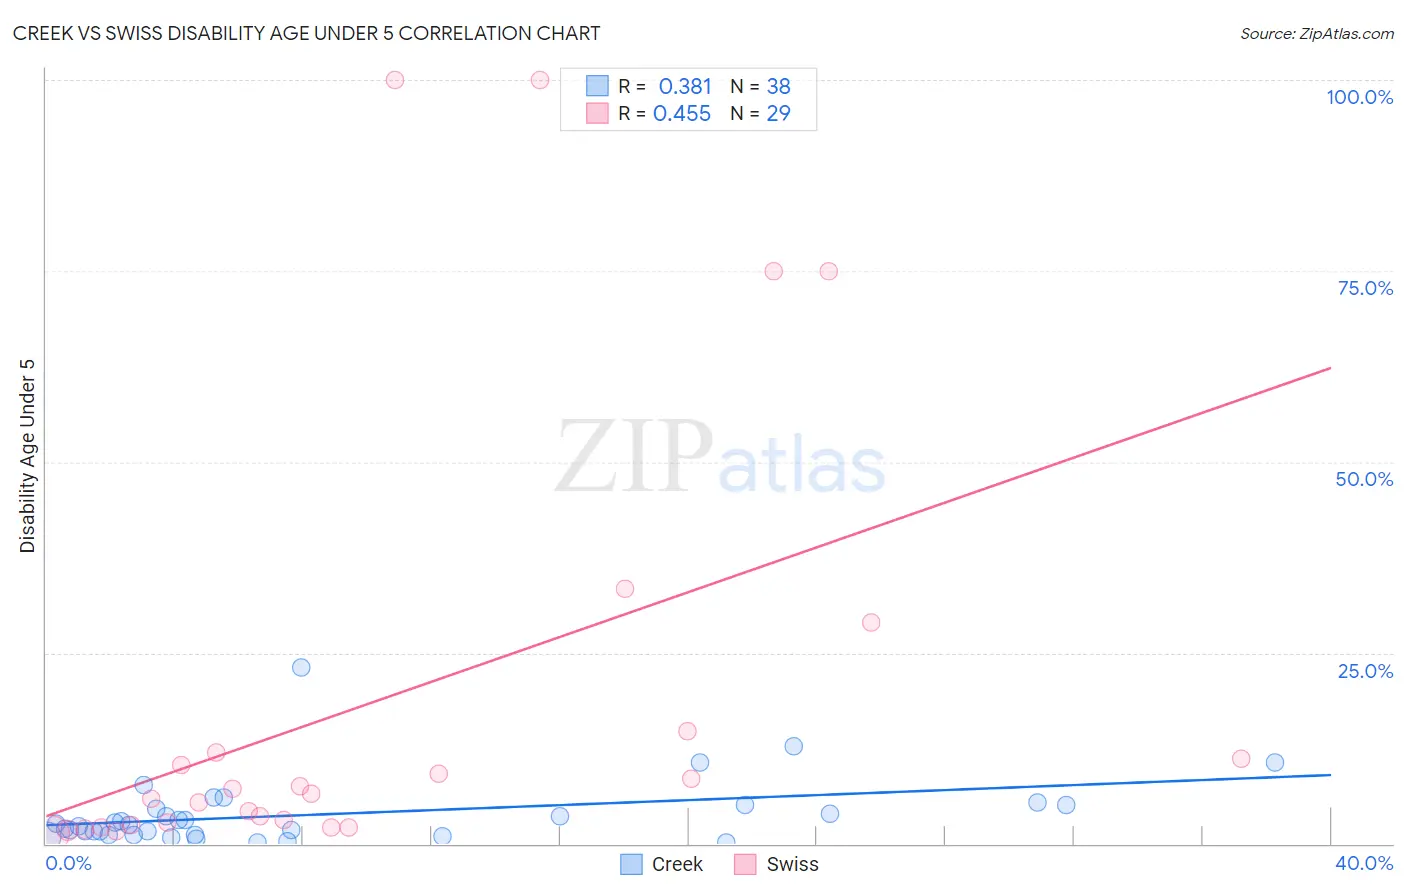
Creek vs Swiss Disability Age Under 5 Correlation Chart
The statistical analysis conducted on geographies consisting of 124,448,174 people shows a mild positive correlation between the proportion of Creek and percentage of population with a disability under the age of 5 in the United States with a correlation coefficient (R) of 0.381 and weighted average of 1.6%. Similarly, the statistical analysis conducted on geographies consisting of 231,156,469 people shows a moderate positive correlation between the proportion of Swiss and percentage of population with a disability under the age of 5 in the United States with a correlation coefficient (R) of 0.455 and weighted average of 1.6%, a difference of 0.83%.
Disability Age Under 5 Correlation Summary
| Measurement | Creek | Swiss |
| Minimum | 0.21% | 1.3% |
| Maximum | 23.1% | 100.0% |
| Range | 22.9% | 98.7% |
| Mean | 3.9% | 18.6% |
| Median | 2.5% | 6.6% |
| Interquartile 25% (IQ1) | 1.2% | 2.4% |
| Interquartile 75% (IQ3) | 5.0% | 13.4% |
| Interquartile Range (IQR) | 3.8% | 11.0% |
| Standard Deviation (Sample) | 4.4% | 29.4% |
| Standard Deviation (Population) | 4.3% | 28.9% |
Demographics Similar to Creek and Swiss by Disability Age Under 5
In terms of disability age under 5, the demographic groups most similar to Creek are Blackfeet (1.6%, a difference of 0.040%), Scottish (1.6%, a difference of 0.070%), Seminole (1.6%, a difference of 0.19%), Navajo (1.6%, a difference of 0.21%), and Cape Verdean (1.7%, a difference of 0.84%). Similarly, the demographic groups most similar to Swiss are Welsh (1.6%, a difference of 0.16%), German Russian (1.6%, a difference of 0.27%), Seminole (1.6%, a difference of 0.63%), Shoshone (1.6%, a difference of 0.72%), and Blackfeet (1.6%, a difference of 0.79%).
| Demographics | Rating | Rank | Disability Age Under 5 |
| Swedes | 0.0 /100 | #294 | Tragic 1.6% |
| Finns | 0.0 /100 | #295 | Tragic 1.6% |
| Poles | 0.0 /100 | #296 | Tragic 1.6% |
| Immigrants | Nonimmigrants | 0.0 /100 | #297 | Tragic 1.6% |
| Cajuns | 0.0 /100 | #298 | Tragic 1.6% |
| Portuguese | 0.0 /100 | #299 | Tragic 1.6% |
| Shoshone | 0.0 /100 | #300 | Tragic 1.6% |
| German Russians | 0.0 /100 | #301 | Tragic 1.6% |
| Welsh | 0.0 /100 | #302 | Tragic 1.6% |
| Swiss | 0.0 /100 | #303 | Tragic 1.6% |
| Seminole | 0.0 /100 | #304 | Tragic 1.6% |
| Blackfeet | 0.0 /100 | #305 | Tragic 1.6% |
| Creek | 0.0 /100 | #306 | Tragic 1.6% |
| Scottish | 0.0 /100 | #307 | Tragic 1.6% |
| Navajo | 0.0 /100 | #308 | Tragic 1.6% |
| Cape Verdeans | 0.0 /100 | #309 | Tragic 1.7% |
| Whites/Caucasians | 0.0 /100 | #310 | Tragic 1.7% |
| English | 0.0 /100 | #311 | Tragic 1.7% |
| Puerto Ricans | 0.0 /100 | #312 | Tragic 1.7% |
| Celtics | 0.0 /100 | #313 | Tragic 1.7% |
| Norwegians | 0.0 /100 | #314 | Tragic 1.7% |