Creek vs Immigrants from Dominica Disability Age Under 5
COMPARE
Creek
Immigrants from Dominica
Disability Age Under 5
Disability Age Under 5 Comparison
Creek
Immigrants from Dominica
1.6%
DISABILITY AGE UNDER 5
0.0/ 100
METRIC RATING
306th/ 347
METRIC RANK
1.4%
DISABILITY AGE UNDER 5
0.2/ 100
METRIC RATING
262nd/ 347
METRIC RANK
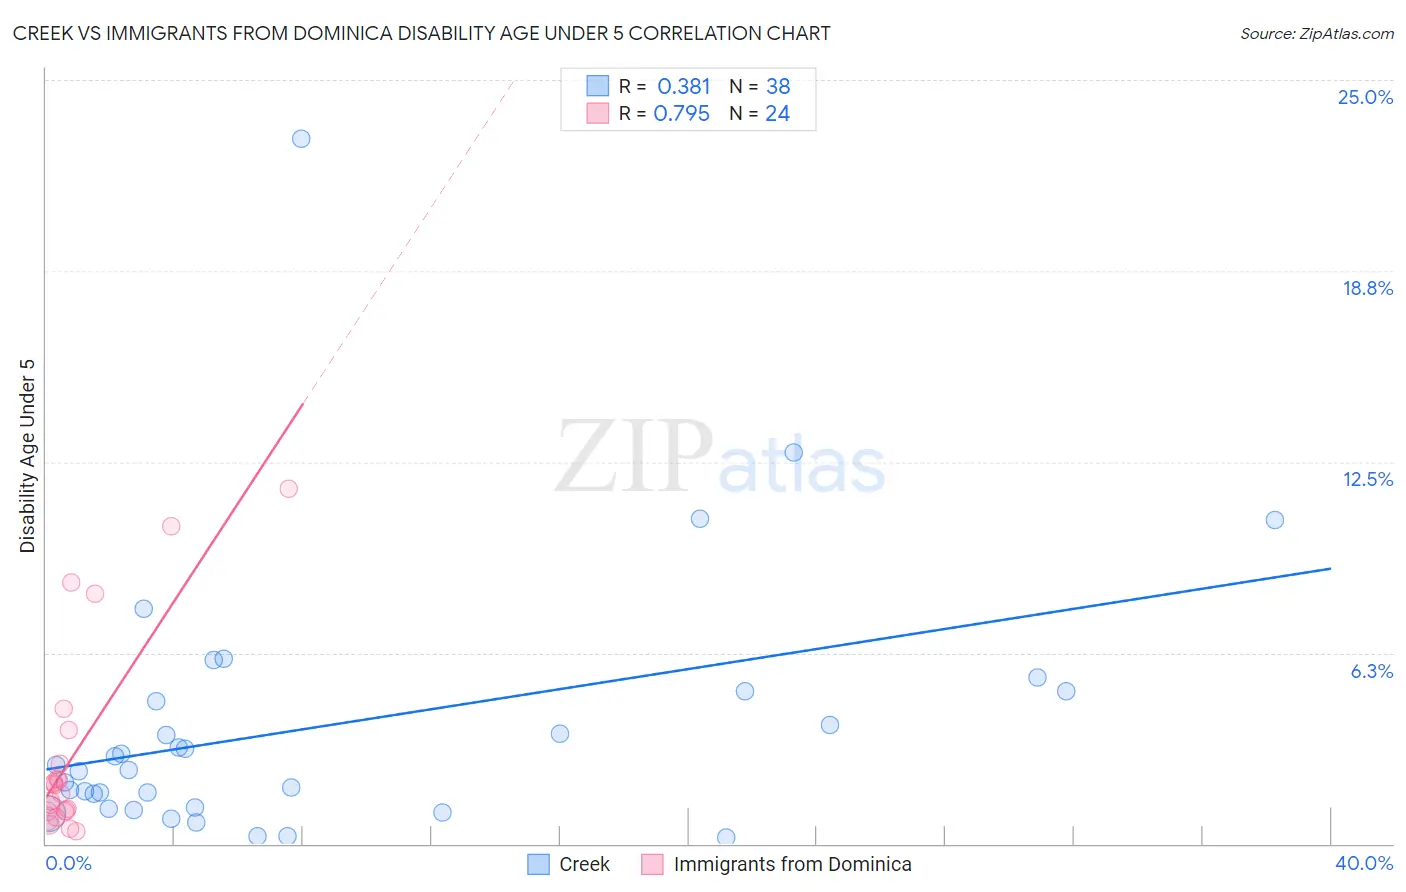
Creek vs Immigrants from Dominica Disability Age Under 5 Correlation Chart
The statistical analysis conducted on geographies consisting of 124,448,174 people shows a mild positive correlation between the proportion of Creek and percentage of population with a disability under the age of 5 in the United States with a correlation coefficient (R) of 0.381 and weighted average of 1.6%. Similarly, the statistical analysis conducted on geographies consisting of 63,480,802 people shows a strong positive correlation between the proportion of Immigrants from Dominica and percentage of population with a disability under the age of 5 in the United States with a correlation coefficient (R) of 0.795 and weighted average of 1.4%, a difference of 16.0%.
Disability Age Under 5 Correlation Summary
| Measurement | Creek | Immigrants from Dominica |
| Minimum | 0.21% | 0.41% |
| Maximum | 23.1% | 11.6% |
| Range | 22.9% | 11.2% |
| Mean | 3.9% | 3.0% |
| Median | 2.5% | 1.8% |
| Interquartile 25% (IQ1) | 1.2% | 1.1% |
| Interquartile 75% (IQ3) | 5.0% | 3.2% |
| Interquartile Range (IQR) | 3.8% | 2.1% |
| Standard Deviation (Sample) | 4.4% | 3.3% |
| Standard Deviation (Population) | 4.3% | 3.2% |
Similar Demographics by Disability Age Under 5
Demographics Similar to Creek by Disability Age Under 5
In terms of disability age under 5, the demographic groups most similar to Creek are Blackfeet (1.6%, a difference of 0.040%), Scottish (1.6%, a difference of 0.070%), Seminole (1.6%, a difference of 0.19%), Navajo (1.6%, a difference of 0.21%), and Swiss (1.6%, a difference of 0.83%).
| Demographics | Rating | Rank | Disability Age Under 5 |
| Portuguese | 0.0 /100 | #299 | Tragic 1.6% |
| Shoshone | 0.0 /100 | #300 | Tragic 1.6% |
| German Russians | 0.0 /100 | #301 | Tragic 1.6% |
| Welsh | 0.0 /100 | #302 | Tragic 1.6% |
| Swiss | 0.0 /100 | #303 | Tragic 1.6% |
| Seminole | 0.0 /100 | #304 | Tragic 1.6% |
| Blackfeet | 0.0 /100 | #305 | Tragic 1.6% |
| Creek | 0.0 /100 | #306 | Tragic 1.6% |
| Scottish | 0.0 /100 | #307 | Tragic 1.6% |
| Navajo | 0.0 /100 | #308 | Tragic 1.6% |
| Cape Verdeans | 0.0 /100 | #309 | Tragic 1.7% |
| Whites/Caucasians | 0.0 /100 | #310 | Tragic 1.7% |
| English | 0.0 /100 | #311 | Tragic 1.7% |
| Puerto Ricans | 0.0 /100 | #312 | Tragic 1.7% |
| Celtics | 0.0 /100 | #313 | Tragic 1.7% |
Demographics Similar to Immigrants from Dominica by Disability Age Under 5
In terms of disability age under 5, the demographic groups most similar to Immigrants from Dominica are Spanish (1.4%, a difference of 0.060%), Immigrants from Netherlands (1.4%, a difference of 0.16%), Yugoslavian (1.4%, a difference of 0.21%), Carpatho Rusyn (1.4%, a difference of 0.25%), and Immigrants from Germany (1.4%, a difference of 0.28%).
| Demographics | Rating | Rank | Disability Age Under 5 |
| Immigrants | Liberia | 0.6 /100 | #255 | Tragic 1.4% |
| Immigrants | Western Europe | 0.5 /100 | #256 | Tragic 1.4% |
| Slovenes | 0.3 /100 | #257 | Tragic 1.4% |
| Costa Ricans | 0.3 /100 | #258 | Tragic 1.4% |
| Immigrants | Southern Europe | 0.3 /100 | #259 | Tragic 1.4% |
| Slavs | 0.3 /100 | #260 | Tragic 1.4% |
| Immigrants | Netherlands | 0.2 /100 | #261 | Tragic 1.4% |
| Immigrants | Dominica | 0.2 /100 | #262 | Tragic 1.4% |
| Spanish | 0.2 /100 | #263 | Tragic 1.4% |
| Yugoslavians | 0.1 /100 | #264 | Tragic 1.4% |
| Carpatho Rusyns | 0.1 /100 | #265 | Tragic 1.4% |
| Immigrants | Germany | 0.1 /100 | #266 | Tragic 1.4% |
| Cree | 0.1 /100 | #267 | Tragic 1.4% |
| Belgians | 0.1 /100 | #268 | Tragic 1.4% |
| Austrians | 0.1 /100 | #269 | Tragic 1.4% |