Immigrants from Kenya vs Swiss Disability Age Under 5
COMPARE
Immigrants from Kenya
Swiss
Disability Age Under 5
Disability Age Under 5 Comparison
Immigrants from Kenya
Swiss
1.2%
DISABILITY AGE UNDER 5
48.6/ 100
METRIC RATING
176th/ 347
METRIC RANK
1.6%
DISABILITY AGE UNDER 5
0.0/ 100
METRIC RATING
303rd/ 347
METRIC RANK
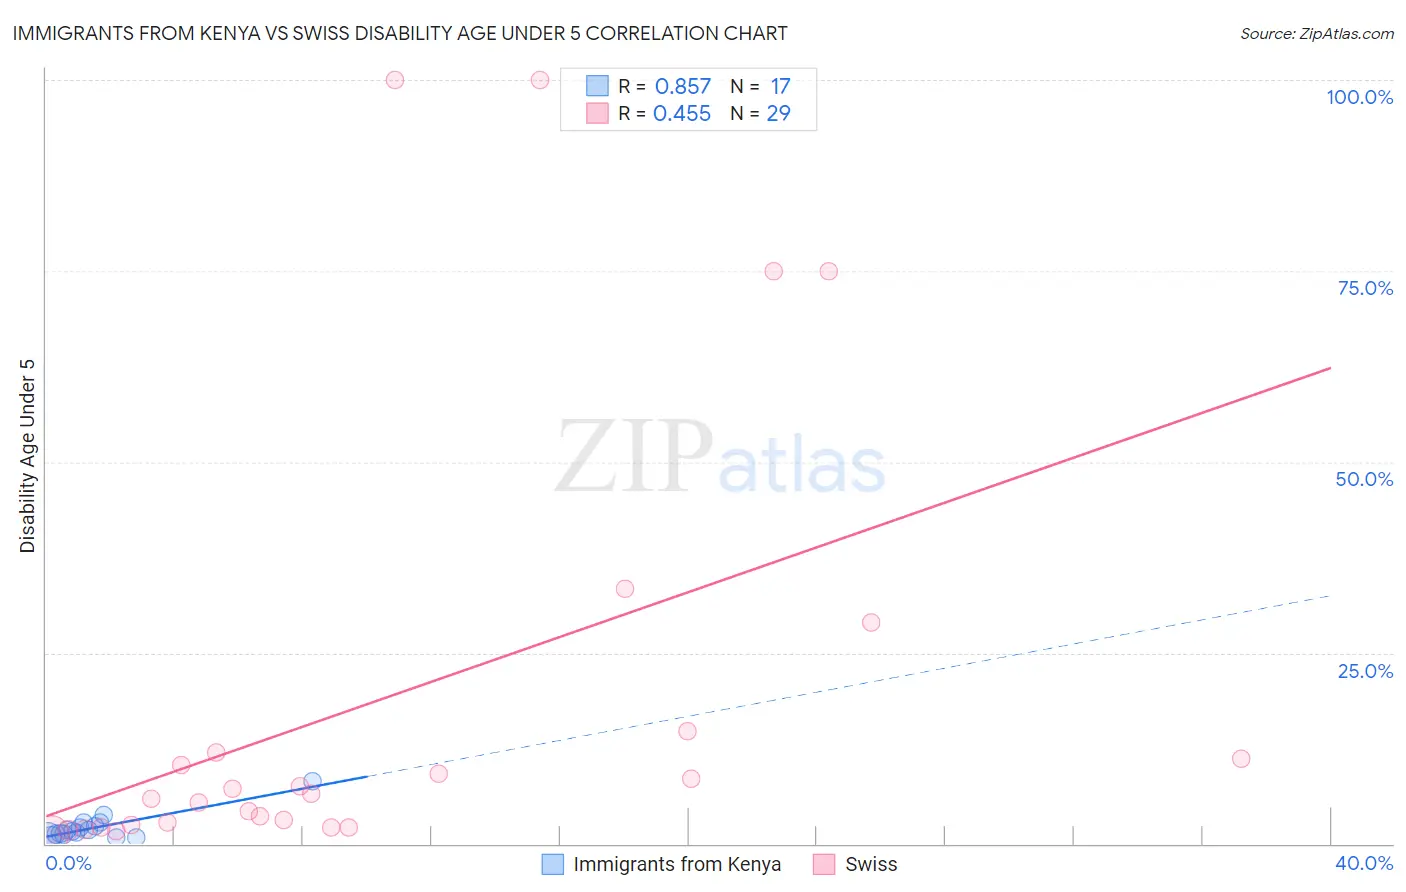
Immigrants from Kenya vs Swiss Disability Age Under 5 Correlation Chart
The statistical analysis conducted on geographies consisting of 142,514,351 people shows a very strong positive correlation between the proportion of Immigrants from Kenya and percentage of population with a disability under the age of 5 in the United States with a correlation coefficient (R) of 0.857 and weighted average of 1.2%. Similarly, the statistical analysis conducted on geographies consisting of 231,156,469 people shows a moderate positive correlation between the proportion of Swiss and percentage of population with a disability under the age of 5 in the United States with a correlation coefficient (R) of 0.455 and weighted average of 1.6%, a difference of 31.5%.
Disability Age Under 5 Correlation Summary
| Measurement | Immigrants from Kenya | Swiss |
| Minimum | 0.82% | 1.3% |
| Maximum | 8.1% | 100.0% |
| Range | 7.3% | 98.7% |
| Mean | 2.1% | 18.6% |
| Median | 1.6% | 6.6% |
| Interquartile 25% (IQ1) | 1.1% | 2.4% |
| Interquartile 75% (IQ3) | 2.5% | 13.4% |
| Interquartile Range (IQR) | 1.3% | 11.0% |
| Standard Deviation (Sample) | 1.7% | 29.4% |
| Standard Deviation (Population) | 1.7% | 28.9% |
Similar Demographics by Disability Age Under 5
Demographics Similar to Immigrants from Kenya by Disability Age Under 5
In terms of disability age under 5, the demographic groups most similar to Immigrants from Kenya are Comanche (1.2%, a difference of 0.090%), Immigrants from Latvia (1.2%, a difference of 0.13%), Immigrants from Nigeria (1.2%, a difference of 0.13%), Venezuelan (1.2%, a difference of 0.14%), and Immigrants from Ireland (1.2%, a difference of 0.15%).
| Demographics | Rating | Rank | Disability Age Under 5 |
| Immigrants | Uruguay | 59.0 /100 | #169 | Average 1.2% |
| Immigrants | Jamaica | 58.8 /100 | #170 | Average 1.2% |
| Guamanians/Chamorros | 57.8 /100 | #171 | Average 1.2% |
| Crow | 51.0 /100 | #172 | Average 1.2% |
| Immigrants | Ireland | 50.3 /100 | #173 | Average 1.2% |
| Immigrants | Latvia | 50.0 /100 | #174 | Average 1.2% |
| Immigrants | Nigeria | 50.0 /100 | #175 | Average 1.2% |
| Immigrants | Kenya | 48.6 /100 | #176 | Average 1.2% |
| Comanche | 47.5 /100 | #177 | Average 1.2% |
| Venezuelans | 47.1 /100 | #178 | Average 1.2% |
| Immigrants | Bahamas | 45.2 /100 | #179 | Average 1.2% |
| Immigrants | Mexico | 44.4 /100 | #180 | Average 1.2% |
| Immigrants | Peru | 43.7 /100 | #181 | Average 1.2% |
| Macedonians | 43.7 /100 | #181 | Average 1.2% |
| Immigrants | Saudi Arabia | 43.3 /100 | #183 | Average 1.2% |
Demographics Similar to Swiss by Disability Age Under 5
In terms of disability age under 5, the demographic groups most similar to Swiss are Welsh (1.6%, a difference of 0.16%), German Russian (1.6%, a difference of 0.27%), Seminole (1.6%, a difference of 0.63%), Shoshone (1.6%, a difference of 0.72%), and Blackfeet (1.6%, a difference of 0.79%).
| Demographics | Rating | Rank | Disability Age Under 5 |
| Poles | 0.0 /100 | #296 | Tragic 1.6% |
| Immigrants | Nonimmigrants | 0.0 /100 | #297 | Tragic 1.6% |
| Cajuns | 0.0 /100 | #298 | Tragic 1.6% |
| Portuguese | 0.0 /100 | #299 | Tragic 1.6% |
| Shoshone | 0.0 /100 | #300 | Tragic 1.6% |
| German Russians | 0.0 /100 | #301 | Tragic 1.6% |
| Welsh | 0.0 /100 | #302 | Tragic 1.6% |
| Swiss | 0.0 /100 | #303 | Tragic 1.6% |
| Seminole | 0.0 /100 | #304 | Tragic 1.6% |
| Blackfeet | 0.0 /100 | #305 | Tragic 1.6% |
| Creek | 0.0 /100 | #306 | Tragic 1.6% |
| Scottish | 0.0 /100 | #307 | Tragic 1.6% |
| Navajo | 0.0 /100 | #308 | Tragic 1.6% |
| Cape Verdeans | 0.0 /100 | #309 | Tragic 1.7% |
| Whites/Caucasians | 0.0 /100 | #310 | Tragic 1.7% |