Slovene vs Immigrants from Northern Europe Hearing Disability
COMPARE
Slovene
Immigrants from Northern Europe
Hearing Disability
Hearing Disability Comparison
Slovenes
Immigrants from Northern Europe
3.5%
HEARING DISABILITY
0.1/ 100
METRIC RATING
259th/ 347
METRIC RANK
3.2%
HEARING DISABILITY
7.0/ 100
METRIC RATING
218th/ 347
METRIC RANK
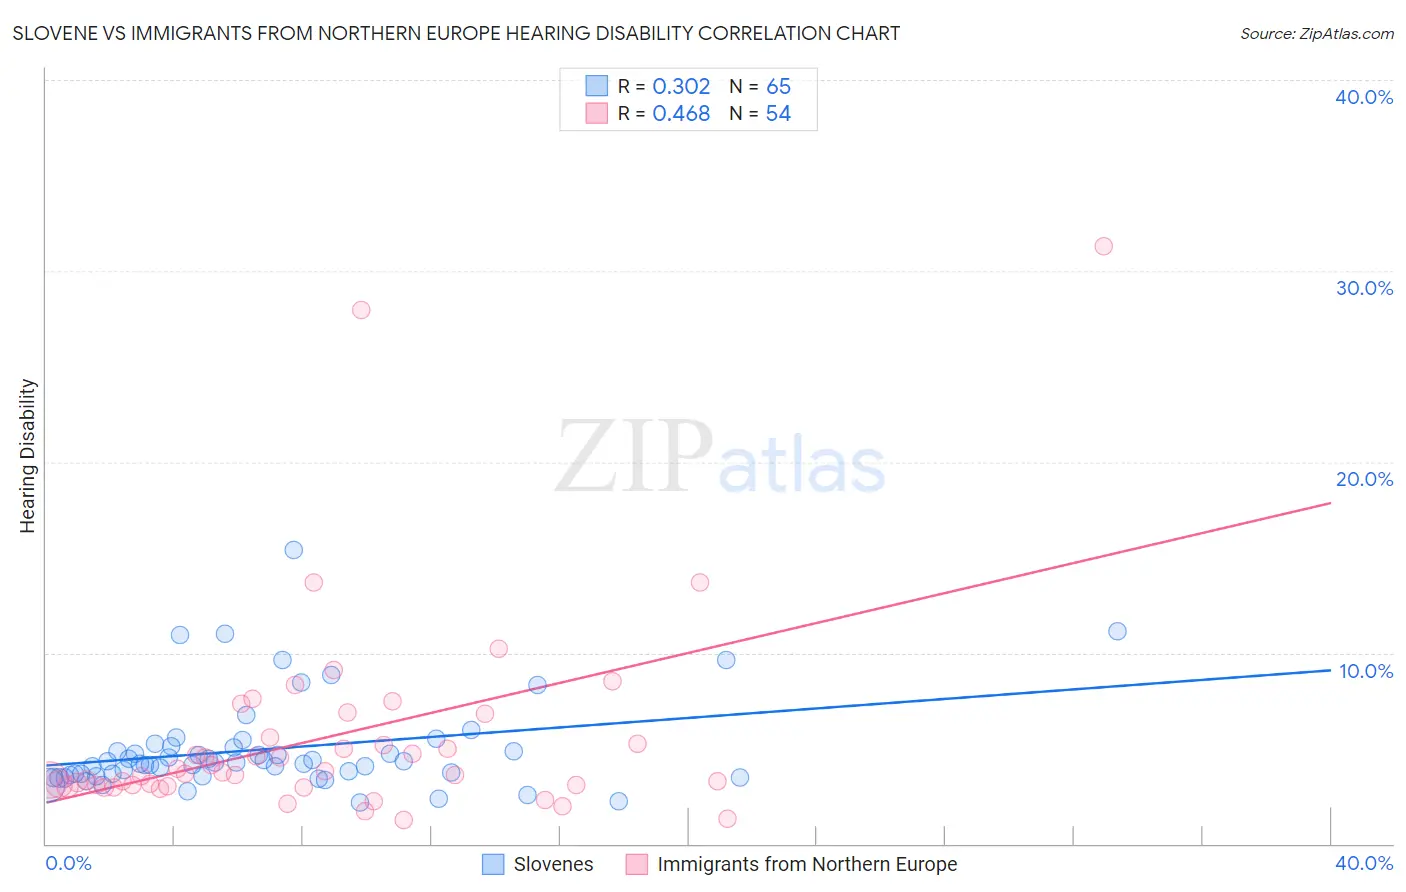
Slovene vs Immigrants from Northern Europe Hearing Disability Correlation Chart
The statistical analysis conducted on geographies consisting of 261,288,798 people shows a mild positive correlation between the proportion of Slovenes and percentage of population with hearing disability in the United States with a correlation coefficient (R) of 0.302 and weighted average of 3.5%. Similarly, the statistical analysis conducted on geographies consisting of 477,037,225 people shows a moderate positive correlation between the proportion of Immigrants from Northern Europe and percentage of population with hearing disability in the United States with a correlation coefficient (R) of 0.468 and weighted average of 3.2%, a difference of 8.8%.
Hearing Disability Correlation Summary
| Measurement | Slovene | Immigrants from Northern Europe |
| Minimum | 2.2% | 1.2% |
| Maximum | 15.4% | 31.3% |
| Range | 13.2% | 30.1% |
| Mean | 5.0% | 5.6% |
| Median | 4.3% | 3.7% |
| Interquartile 25% (IQ1) | 3.6% | 3.1% |
| Interquartile 75% (IQ3) | 5.1% | 5.5% |
| Interquartile Range (IQR) | 1.5% | 2.5% |
| Standard Deviation (Sample) | 2.5% | 5.5% |
| Standard Deviation (Population) | 2.4% | 5.4% |
Similar Demographics by Hearing Disability
Demographics Similar to Slovenes by Hearing Disability
In terms of hearing disability, the demographic groups most similar to Slovenes are Portuguese (3.5%, a difference of 0.080%), Hawaiian (3.5%, a difference of 0.11%), Immigrants from North America (3.5%, a difference of 0.23%), Northern European (3.4%, a difference of 0.24%), and Immigrants from Canada (3.5%, a difference of 0.27%).
| Demographics | Rating | Rank | Hearing Disability |
| Croatians | 0.4 /100 | #252 | Tragic 3.4% |
| Carpatho Rusyns | 0.3 /100 | #253 | Tragic 3.4% |
| Slavs | 0.2 /100 | #254 | Tragic 3.4% |
| Poles | 0.2 /100 | #255 | Tragic 3.4% |
| Hmong | 0.2 /100 | #256 | Tragic 3.4% |
| Yaqui | 0.2 /100 | #257 | Tragic 3.4% |
| Northern Europeans | 0.2 /100 | #258 | Tragic 3.4% |
| Slovenes | 0.1 /100 | #259 | Tragic 3.5% |
| Portuguese | 0.1 /100 | #260 | Tragic 3.5% |
| Hawaiians | 0.1 /100 | #261 | Tragic 3.5% |
| Immigrants | North America | 0.1 /100 | #262 | Tragic 3.5% |
| Immigrants | Canada | 0.1 /100 | #263 | Tragic 3.5% |
| Immigrants | Germany | 0.1 /100 | #264 | Tragic 3.5% |
| British | 0.1 /100 | #265 | Tragic 3.5% |
| Belgians | 0.1 /100 | #266 | Tragic 3.5% |
Demographics Similar to Immigrants from Northern Europe by Hearing Disability
In terms of hearing disability, the demographic groups most similar to Immigrants from Northern Europe are Russian (3.2%, a difference of 0.040%), New Zealander (3.2%, a difference of 0.060%), Immigrants from Norway (3.2%, a difference of 0.12%), Malaysian (3.2%, a difference of 0.12%), and Immigrants from Laos (3.2%, a difference of 0.12%).
| Demographics | Rating | Rank | Hearing Disability |
| Romanians | 12.1 /100 | #211 | Poor 3.1% |
| Pakistanis | 11.1 /100 | #212 | Poor 3.1% |
| Immigrants | Iraq | 10.5 /100 | #213 | Poor 3.1% |
| Australians | 8.1 /100 | #214 | Tragic 3.2% |
| Bangladeshis | 8.1 /100 | #215 | Tragic 3.2% |
| Immigrants | Norway | 7.3 /100 | #216 | Tragic 3.2% |
| Russians | 7.1 /100 | #217 | Tragic 3.2% |
| Immigrants | Northern Europe | 7.0 /100 | #218 | Tragic 3.2% |
| New Zealanders | 6.8 /100 | #219 | Tragic 3.2% |
| Malaysians | 6.6 /100 | #220 | Tragic 3.2% |
| Immigrants | Laos | 6.6 /100 | #221 | Tragic 3.2% |
| Immigrants | Oceania | 6.5 /100 | #222 | Tragic 3.2% |
| Mexicans | 5.6 /100 | #223 | Tragic 3.2% |
| Icelanders | 5.2 /100 | #224 | Tragic 3.2% |
| Latvians | 5.1 /100 | #225 | Tragic 3.2% |