Cree vs Immigrants from Yemen Male Disability
COMPARE
Cree
Immigrants from Yemen
Male Disability
Male Disability Comparison
Cree
Immigrants from Yemen
13.7%
MALE DISABILITY
0.0/ 100
METRIC RATING
318th/ 347
METRIC RANK
12.0%
MALE DISABILITY
0.5/ 100
METRIC RATING
249th/ 347
METRIC RANK
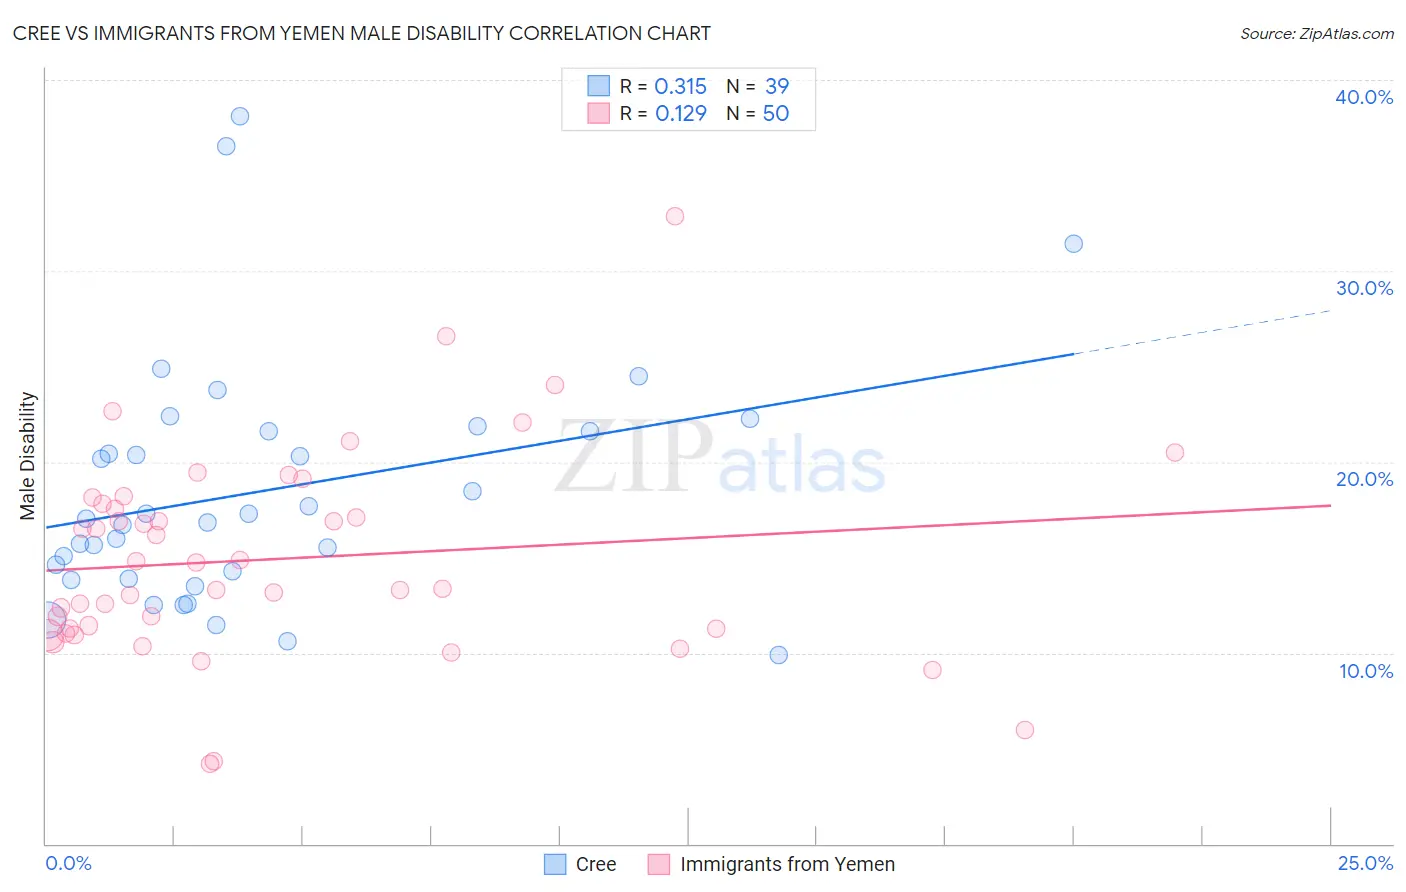
Cree vs Immigrants from Yemen Male Disability Correlation Chart
The statistical analysis conducted on geographies consisting of 76,208,606 people shows a mild positive correlation between the proportion of Cree and percentage of males with a disability in the United States with a correlation coefficient (R) of 0.315 and weighted average of 13.7%. Similarly, the statistical analysis conducted on geographies consisting of 82,432,015 people shows a poor positive correlation between the proportion of Immigrants from Yemen and percentage of males with a disability in the United States with a correlation coefficient (R) of 0.129 and weighted average of 12.0%, a difference of 14.1%.
Male Disability Correlation Summary
| Measurement | Cree | Immigrants from Yemen |
| Minimum | 9.9% | 4.2% |
| Maximum | 38.1% | 32.8% |
| Range | 28.2% | 28.6% |
| Mean | 18.5% | 14.9% |
| Median | 17.0% | 14.0% |
| Interquartile 25% (IQ1) | 13.9% | 11.3% |
| Interquartile 75% (IQ3) | 21.6% | 17.8% |
| Interquartile Range (IQR) | 7.7% | 6.6% |
| Standard Deviation (Sample) | 6.4% | 5.4% |
| Standard Deviation (Population) | 6.3% | 5.4% |
Similar Demographics by Male Disability
Demographics Similar to Cree by Male Disability
In terms of male disability, the demographic groups most similar to Cree are Paiute (13.7%, a difference of 0.21%), American (13.8%, a difference of 0.41%), Tlingit-Haida (13.8%, a difference of 0.90%), Shoshone (13.8%, a difference of 0.96%), and Alaska Native (13.6%, a difference of 1.0%).
| Demographics | Rating | Rank | Male Disability |
| Delaware | 0.0 /100 | #311 | Tragic 13.5% |
| Yakama | 0.0 /100 | #312 | Tragic 13.5% |
| Puget Sound Salish | 0.0 /100 | #313 | Tragic 13.5% |
| Aleuts | 0.0 /100 | #314 | Tragic 13.5% |
| Iroquois | 0.0 /100 | #315 | Tragic 13.6% |
| Alaska Natives | 0.0 /100 | #316 | Tragic 13.6% |
| Paiute | 0.0 /100 | #317 | Tragic 13.7% |
| Cree | 0.0 /100 | #318 | Tragic 13.7% |
| Americans | 0.0 /100 | #319 | Tragic 13.8% |
| Tlingit-Haida | 0.0 /100 | #320 | Tragic 13.8% |
| Shoshone | 0.0 /100 | #321 | Tragic 13.8% |
| Apache | 0.0 /100 | #322 | Tragic 14.0% |
| Osage | 0.0 /100 | #323 | Tragic 14.0% |
| Comanche | 0.0 /100 | #324 | Tragic 14.1% |
| Ottawa | 0.0 /100 | #325 | Tragic 14.1% |
Demographics Similar to Immigrants from Yemen by Male Disability
In terms of male disability, the demographic groups most similar to Immigrants from Yemen are Bangladeshi (12.0%, a difference of 0.050%), German Russian (12.0%, a difference of 0.060%), Slovene (12.0%, a difference of 0.13%), Guamanian/Chamorro (12.0%, a difference of 0.13%), and British (12.1%, a difference of 0.32%).
| Demographics | Rating | Rank | Male Disability |
| Northern Europeans | 1.1 /100 | #242 | Tragic 11.9% |
| Samoans | 1.1 /100 | #243 | Tragic 11.9% |
| Immigrants | Laos | 1.0 /100 | #244 | Tragic 11.9% |
| Immigrants | Liberia | 1.0 /100 | #245 | Tragic 11.9% |
| Danes | 0.9 /100 | #246 | Tragic 11.9% |
| Hungarians | 0.8 /100 | #247 | Tragic 12.0% |
| Poles | 0.7 /100 | #248 | Tragic 12.0% |
| Immigrants | Yemen | 0.5 /100 | #249 | Tragic 12.0% |
| Bangladeshis | 0.5 /100 | #250 | Tragic 12.0% |
| German Russians | 0.5 /100 | #251 | Tragic 12.0% |
| Slovenes | 0.5 /100 | #252 | Tragic 12.0% |
| Guamanians/Chamorros | 0.5 /100 | #253 | Tragic 12.0% |
| British | 0.4 /100 | #254 | Tragic 12.1% |
| Chinese | 0.4 /100 | #255 | Tragic 12.1% |
| Swiss | 0.3 /100 | #256 | Tragic 12.1% |