Cree vs Immigrants from Yemen Unemployment Among Ages 65 to 74 years
COMPARE
Cree
Immigrants from Yemen
Unemployment Among Ages 65 to 74 years
Unemployment Among Ages 65 to 74 years Comparison
Cree
Immigrants from Yemen
5.6%
UNEMPLOYMENT AMONG AGES 65 TO 74 YEARS
1.4/ 100
METRIC RATING
241st/ 347
METRIC RANK
8.3%
UNEMPLOYMENT AMONG AGES 65 TO 74 YEARS
0.0/ 100
METRIC RATING
345th/ 347
METRIC RANK
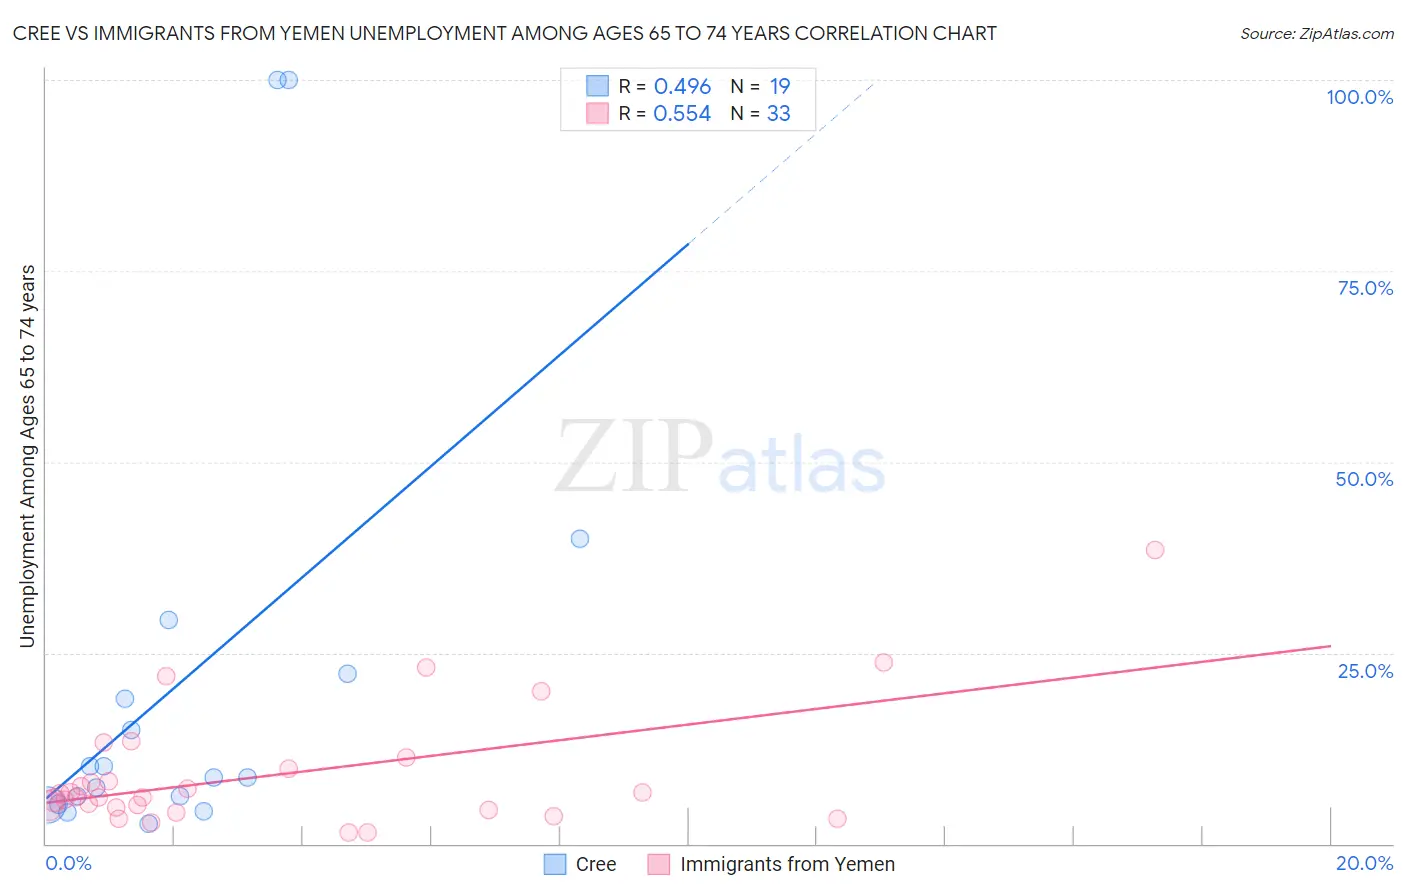
Cree vs Immigrants from Yemen Unemployment Among Ages 65 to 74 years Correlation Chart
The statistical analysis conducted on geographies consisting of 72,950,137 people shows a moderate positive correlation between the proportion of Cree and unemployment rate among population between the ages 65 and 74 in the United States with a correlation coefficient (R) of 0.496 and weighted average of 5.6%. Similarly, the statistical analysis conducted on geographies consisting of 79,591,672 people shows a substantial positive correlation between the proportion of Immigrants from Yemen and unemployment rate among population between the ages 65 and 74 in the United States with a correlation coefficient (R) of 0.554 and weighted average of 8.3%, a difference of 48.6%.
Unemployment Among Ages 65 to 74 years Correlation Summary
| Measurement | Cree | Immigrants from Yemen |
| Minimum | 2.6% | 1.4% |
| Maximum | 100.0% | 38.4% |
| Range | 97.4% | 37.0% |
| Mean | 21.3% | 9.1% |
| Median | 8.7% | 6.1% |
| Interquartile 25% (IQ1) | 5.2% | 4.6% |
| Interquartile 75% (IQ3) | 22.2% | 10.6% |
| Interquartile Range (IQR) | 17.0% | 6.0% |
| Standard Deviation (Sample) | 29.4% | 8.0% |
| Standard Deviation (Population) | 28.6% | 7.9% |
Similar Demographics by Unemployment Among Ages 65 to 74 years
Demographics Similar to Cree by Unemployment Among Ages 65 to 74 years
In terms of unemployment among ages 65 to 74 years, the demographic groups most similar to Cree are Immigrants from Ghana (5.6%, a difference of 0.0%), Ghanaian (5.6%, a difference of 0.030%), Immigrants from Peru (5.6%, a difference of 0.060%), German Russian (5.5%, a difference of 0.13%), and Cajun (5.5%, a difference of 0.21%).
| Demographics | Rating | Rank | Unemployment Among Ages 65 to 74 years |
| French American Indians | 2.2 /100 | #234 | Tragic 5.5% |
| Peruvians | 2.2 /100 | #235 | Tragic 5.5% |
| Hopi | 2.2 /100 | #236 | Tragic 5.5% |
| Immigrants | Belize | 2.2 /100 | #237 | Tragic 5.5% |
| Cajuns | 1.8 /100 | #238 | Tragic 5.5% |
| German Russians | 1.6 /100 | #239 | Tragic 5.5% |
| Ghanaians | 1.4 /100 | #240 | Tragic 5.6% |
| Cree | 1.4 /100 | #241 | Tragic 5.6% |
| Immigrants | Ghana | 1.4 /100 | #242 | Tragic 5.6% |
| Immigrants | Peru | 1.3 /100 | #243 | Tragic 5.6% |
| Immigrants | Micronesia | 0.9 /100 | #244 | Tragic 5.6% |
| Immigrants | Greece | 0.9 /100 | #245 | Tragic 5.6% |
| Paraguayans | 0.9 /100 | #246 | Tragic 5.6% |
| Immigrants | Immigrants | 0.9 /100 | #247 | Tragic 5.6% |
| Immigrants | Argentina | 0.9 /100 | #248 | Tragic 5.6% |
Demographics Similar to Immigrants from Yemen by Unemployment Among Ages 65 to 74 years
In terms of unemployment among ages 65 to 74 years, the demographic groups most similar to Immigrants from Yemen are Inupiat (7.5%, a difference of 10.2%), Alaskan Athabascan (7.4%, a difference of 12.3%), Yup'ik (9.5%, a difference of 14.6%), Navajo (6.9%, a difference of 19.2%), and Alaska Native (6.8%, a difference of 20.9%).
| Demographics | Rating | Rank | Unemployment Among Ages 65 to 74 years |
| Paiute | 0.0 /100 | #333 | Tragic 6.3% |
| Taiwanese | 0.0 /100 | #334 | Tragic 6.3% |
| Puerto Ricans | 0.0 /100 | #335 | Tragic 6.4% |
| Immigrants | Armenia | 0.0 /100 | #336 | Tragic 6.5% |
| Ute | 0.0 /100 | #337 | Tragic 6.5% |
| Tlingit-Haida | 0.0 /100 | #338 | Tragic 6.5% |
| Yakama | 0.0 /100 | #339 | Tragic 6.6% |
| Pima | 0.0 /100 | #340 | Tragic 6.6% |
| Alaska Natives | 0.0 /100 | #341 | Tragic 6.8% |
| Navajo | 0.0 /100 | #342 | Tragic 6.9% |
| Alaskan Athabascans | 0.0 /100 | #343 | Tragic 7.4% |
| Inupiat | 0.0 /100 | #344 | Tragic 7.5% |
| Immigrants | Yemen | 0.0 /100 | #345 | Tragic 8.3% |
| Yup'ik | 0.0 /100 | #346 | Tragic 9.5% |
| Crow | 0.0 /100 | #347 | Tragic 17.4% |