Slovene vs Immigrants from Yemen Male Disability
COMPARE
Slovene
Immigrants from Yemen
Male Disability
Male Disability Comparison
Slovenes
Immigrants from Yemen
12.0%
MALE DISABILITY
0.5/ 100
METRIC RATING
252nd/ 347
METRIC RANK
12.0%
MALE DISABILITY
0.5/ 100
METRIC RATING
249th/ 347
METRIC RANK
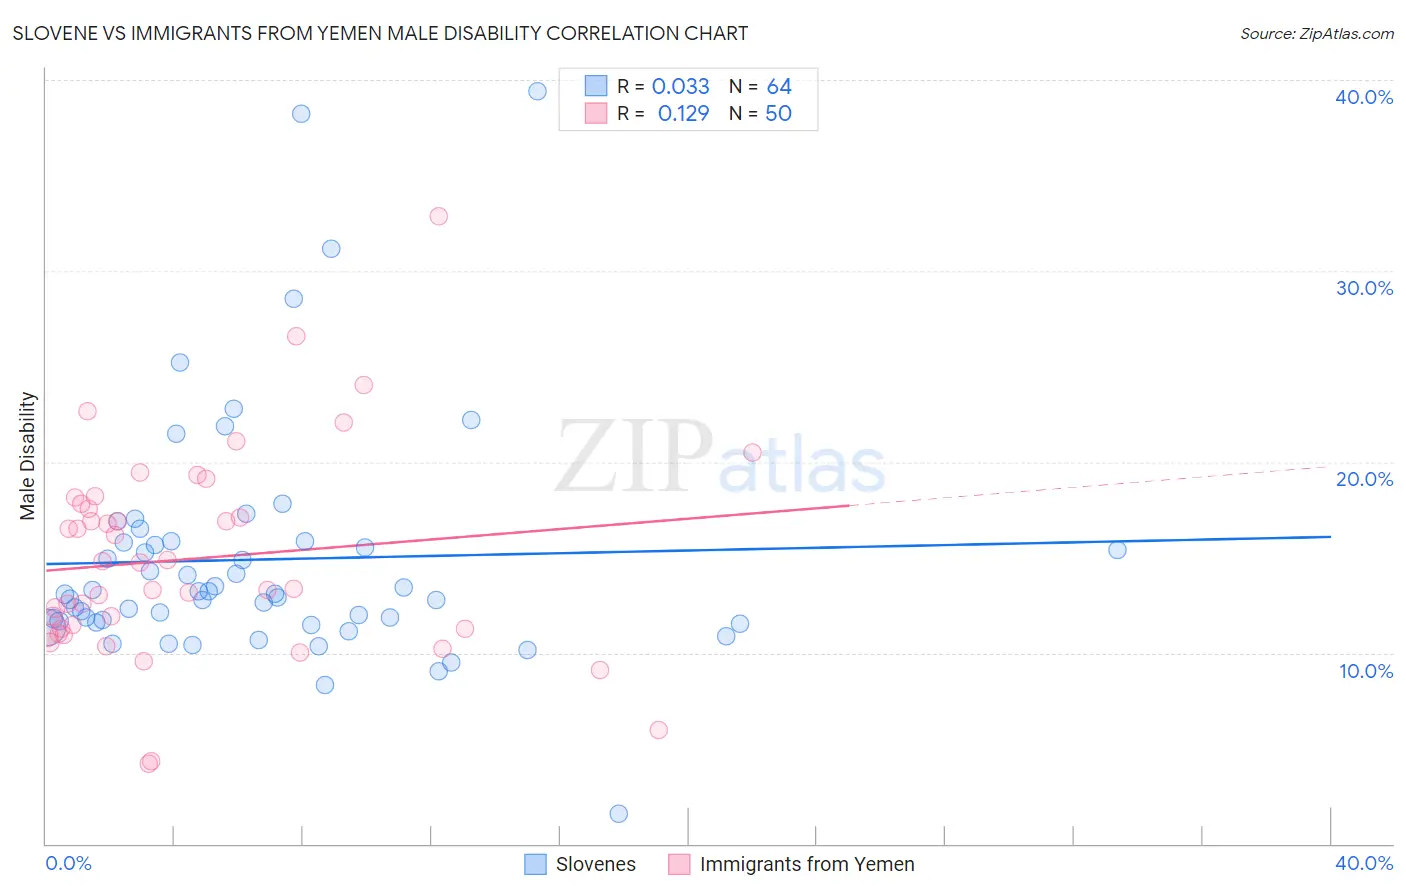
Slovene vs Immigrants from Yemen Male Disability Correlation Chart
The statistical analysis conducted on geographies consisting of 261,347,999 people shows no correlation between the proportion of Slovenes and percentage of males with a disability in the United States with a correlation coefficient (R) of 0.033 and weighted average of 12.0%. Similarly, the statistical analysis conducted on geographies consisting of 82,432,015 people shows a poor positive correlation between the proportion of Immigrants from Yemen and percentage of males with a disability in the United States with a correlation coefficient (R) of 0.129 and weighted average of 12.0%, a difference of 0.13%.
Male Disability Correlation Summary
| Measurement | Slovene | Immigrants from Yemen |
| Minimum | 1.6% | 4.2% |
| Maximum | 39.4% | 32.8% |
| Range | 37.8% | 28.6% |
| Mean | 14.9% | 14.9% |
| Median | 13.1% | 14.0% |
| Interquartile 25% (IQ1) | 11.6% | 11.3% |
| Interquartile 75% (IQ3) | 15.8% | 17.8% |
| Interquartile Range (IQR) | 4.2% | 6.6% |
| Standard Deviation (Sample) | 6.4% | 5.4% |
| Standard Deviation (Population) | 6.3% | 5.4% |
Demographics Similar to Slovenes and Immigrants from Yemen by Male Disability
In terms of male disability, the demographic groups most similar to Slovenes are Guamanian/Chamorro (12.0%, a difference of 0.0%), German Russian (12.0%, a difference of 0.070%), Bangladeshi (12.0%, a difference of 0.080%), British (12.1%, a difference of 0.19%), and Chinese (12.1%, a difference of 0.20%). Similarly, the demographic groups most similar to Immigrants from Yemen are Bangladeshi (12.0%, a difference of 0.050%), German Russian (12.0%, a difference of 0.060%), Guamanian/Chamorro (12.0%, a difference of 0.13%), British (12.1%, a difference of 0.32%), and Chinese (12.1%, a difference of 0.33%).
| Demographics | Rating | Rank | Male Disability |
| Czechs | 1.1 /100 | #240 | Tragic 11.9% |
| Bahamians | 1.1 /100 | #241 | Tragic 11.9% |
| Northern Europeans | 1.1 /100 | #242 | Tragic 11.9% |
| Samoans | 1.1 /100 | #243 | Tragic 11.9% |
| Immigrants | Laos | 1.0 /100 | #244 | Tragic 11.9% |
| Immigrants | Liberia | 1.0 /100 | #245 | Tragic 11.9% |
| Danes | 0.9 /100 | #246 | Tragic 11.9% |
| Hungarians | 0.8 /100 | #247 | Tragic 12.0% |
| Poles | 0.7 /100 | #248 | Tragic 12.0% |
| Immigrants | Yemen | 0.5 /100 | #249 | Tragic 12.0% |
| Bangladeshis | 0.5 /100 | #250 | Tragic 12.0% |
| German Russians | 0.5 /100 | #251 | Tragic 12.0% |
| Slovenes | 0.5 /100 | #252 | Tragic 12.0% |
| Guamanians/Chamorros | 0.5 /100 | #253 | Tragic 12.0% |
| British | 0.4 /100 | #254 | Tragic 12.1% |
| Chinese | 0.4 /100 | #255 | Tragic 12.1% |
| Swiss | 0.3 /100 | #256 | Tragic 12.1% |
| Europeans | 0.3 /100 | #257 | Tragic 12.1% |
| Basques | 0.3 /100 | #258 | Tragic 12.1% |
| Belgians | 0.3 /100 | #259 | Tragic 12.1% |
| Swedes | 0.3 /100 | #260 | Tragic 12.1% |