Sioux vs Immigrants from Guatemala Cognitive Disability
COMPARE
Sioux
Immigrants from Guatemala
Cognitive Disability
Cognitive Disability Comparison
Sioux
Immigrants from Guatemala
17.3%
COGNITIVE DISABILITY
48.6/ 100
METRIC RATING
179th/ 347
METRIC RANK
17.7%
COGNITIVE DISABILITY
2.2/ 100
METRIC RATING
229th/ 347
METRIC RANK
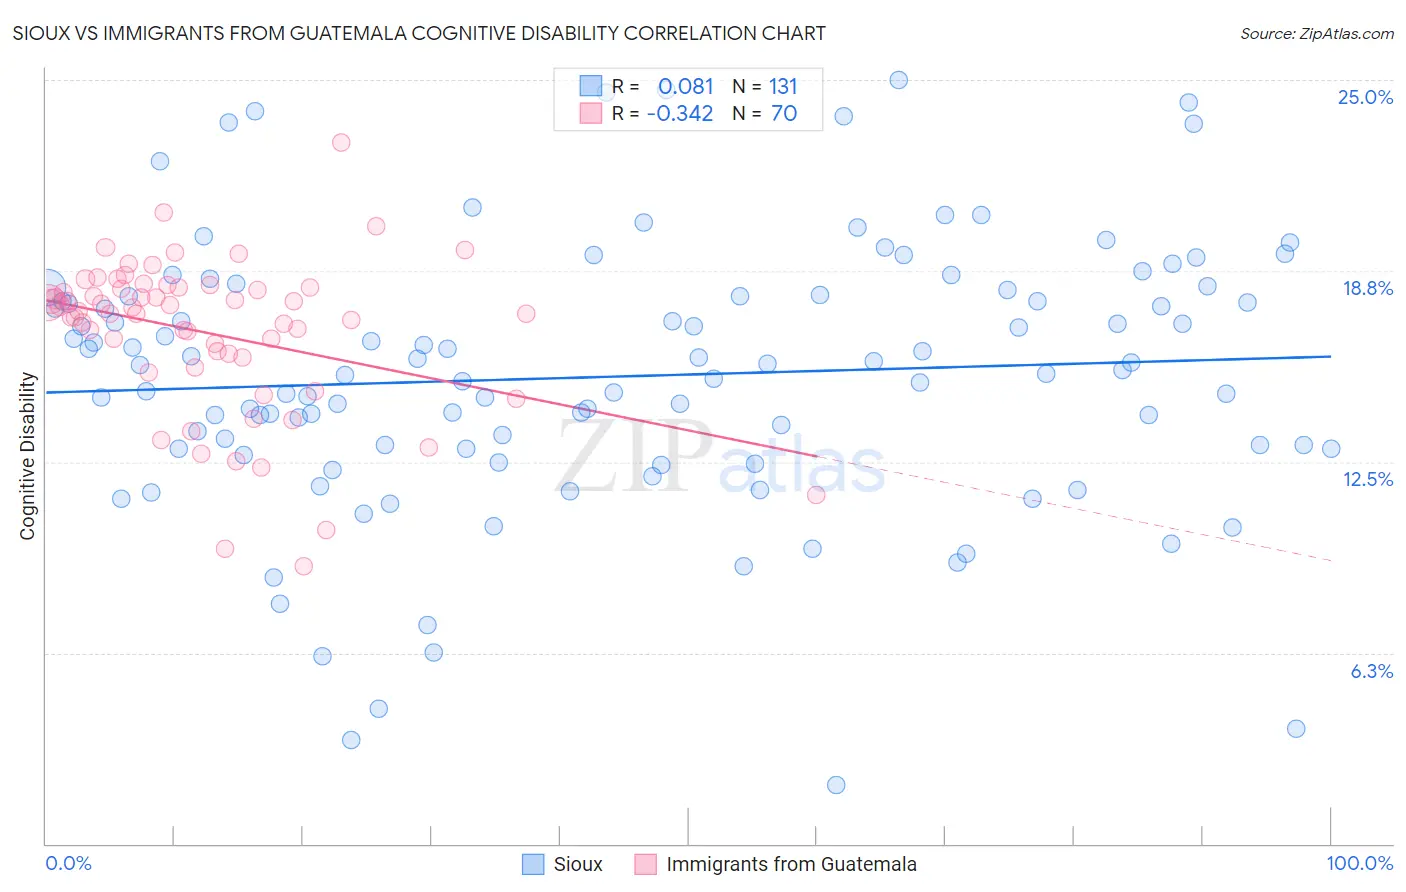
Sioux vs Immigrants from Guatemala Cognitive Disability Correlation Chart
The statistical analysis conducted on geographies consisting of 234,153,820 people shows a slight positive correlation between the proportion of Sioux and percentage of population with cognitive disability in the United States with a correlation coefficient (R) of 0.081 and weighted average of 17.3%. Similarly, the statistical analysis conducted on geographies consisting of 377,233,463 people shows a mild negative correlation between the proportion of Immigrants from Guatemala and percentage of population with cognitive disability in the United States with a correlation coefficient (R) of -0.342 and weighted average of 17.7%, a difference of 2.6%.
Cognitive Disability Correlation Summary
| Measurement | Sioux | Immigrants from Guatemala |
| Minimum | 1.9% | 9.1% |
| Maximum | 25.0% | 22.9% |
| Range | 23.1% | 13.8% |
| Mean | 15.3% | 16.7% |
| Median | 15.5% | 17.4% |
| Interquartile 25% (IQ1) | 12.9% | 15.9% |
| Interquartile 75% (IQ3) | 17.9% | 18.2% |
| Interquartile Range (IQR) | 5.0% | 2.3% |
| Standard Deviation (Sample) | 4.4% | 2.6% |
| Standard Deviation (Population) | 4.4% | 2.5% |
Similar Demographics by Cognitive Disability
Demographics Similar to Sioux by Cognitive Disability
In terms of cognitive disability, the demographic groups most similar to Sioux are Ute (17.3%, a difference of 0.010%), Spanish (17.3%, a difference of 0.010%), Shoshone (17.3%, a difference of 0.020%), Tsimshian (17.3%, a difference of 0.030%), and Laotian (17.3%, a difference of 0.040%).
| Demographics | Rating | Rank | Cognitive Disability |
| Immigrants | Turkey | 56.7 /100 | #172 | Average 17.2% |
| Immigrants | Northern Africa | 50.2 /100 | #173 | Average 17.3% |
| Laotians | 50.0 /100 | #174 | Average 17.3% |
| Tsimshian | 49.8 /100 | #175 | Average 17.3% |
| Shoshone | 49.2 /100 | #176 | Average 17.3% |
| Ute | 49.1 /100 | #177 | Average 17.3% |
| Spanish | 48.9 /100 | #178 | Average 17.3% |
| Sioux | 48.6 /100 | #179 | Average 17.3% |
| Pakistanis | 43.9 /100 | #180 | Average 17.3% |
| Immigrants | Guyana | 42.9 /100 | #181 | Average 17.3% |
| Arabs | 42.8 /100 | #182 | Average 17.3% |
| Spaniards | 40.3 /100 | #183 | Average 17.3% |
| Crow | 39.1 /100 | #184 | Fair 17.3% |
| Afghans | 38.2 /100 | #185 | Fair 17.3% |
| Cambodians | 35.9 /100 | #186 | Fair 17.3% |
Demographics Similar to Immigrants from Guatemala by Cognitive Disability
In terms of cognitive disability, the demographic groups most similar to Immigrants from Guatemala are Immigrants from Central America (17.7%, a difference of 0.020%), Mongolian (17.7%, a difference of 0.020%), Guatemalan (17.8%, a difference of 0.060%), Tongan (17.8%, a difference of 0.060%), and Panamanian (17.8%, a difference of 0.060%).
| Demographics | Rating | Rank | Cognitive Disability |
| Central Americans | 4.5 /100 | #222 | Tragic 17.7% |
| Alsatians | 4.5 /100 | #223 | Tragic 17.7% |
| Fijians | 3.4 /100 | #224 | Tragic 17.7% |
| Vietnamese | 3.4 /100 | #225 | Tragic 17.7% |
| Marshallese | 2.7 /100 | #226 | Tragic 17.7% |
| Immigrants | St. Vincent and the Grenadines | 2.6 /100 | #227 | Tragic 17.7% |
| Immigrants | Central America | 2.3 /100 | #228 | Tragic 17.7% |
| Immigrants | Guatemala | 2.2 /100 | #229 | Tragic 17.7% |
| Mongolians | 2.2 /100 | #230 | Tragic 17.7% |
| Guatemalans | 2.1 /100 | #231 | Tragic 17.8% |
| Tongans | 2.1 /100 | #232 | Tragic 17.8% |
| Panamanians | 2.1 /100 | #233 | Tragic 17.8% |
| Osage | 2.0 /100 | #234 | Tragic 17.8% |
| Spanish American Indians | 2.0 /100 | #235 | Tragic 17.8% |
| Immigrants | Iraq | 1.8 /100 | #236 | Tragic 17.8% |