Immigrants from Hong Kong vs Immigrants from Guatemala Cognitive Disability
COMPARE
Immigrants from Hong Kong
Immigrants from Guatemala
Cognitive Disability
Cognitive Disability Comparison
Immigrants from Hong Kong
Immigrants from Guatemala
16.0%
COGNITIVE DISABILITY
100.0/ 100
METRIC RATING
5th/ 347
METRIC RANK
17.7%
COGNITIVE DISABILITY
2.2/ 100
METRIC RATING
229th/ 347
METRIC RANK
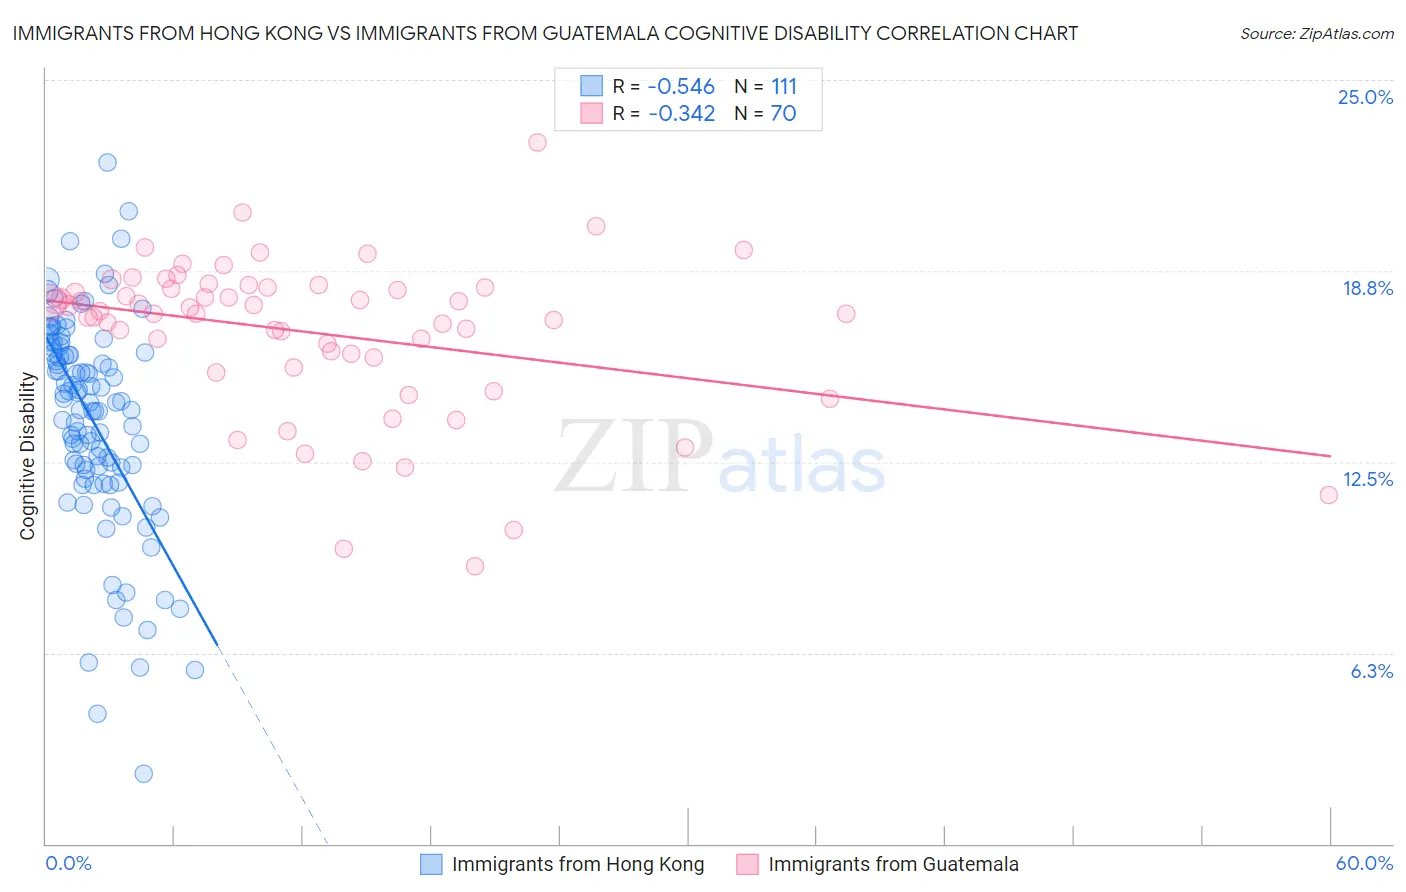
Immigrants from Hong Kong vs Immigrants from Guatemala Cognitive Disability Correlation Chart
The statistical analysis conducted on geographies consisting of 253,985,578 people shows a substantial negative correlation between the proportion of Immigrants from Hong Kong and percentage of population with cognitive disability in the United States with a correlation coefficient (R) of -0.546 and weighted average of 16.0%. Similarly, the statistical analysis conducted on geographies consisting of 377,233,463 people shows a mild negative correlation between the proportion of Immigrants from Guatemala and percentage of population with cognitive disability in the United States with a correlation coefficient (R) of -0.342 and weighted average of 17.7%, a difference of 10.7%.
Cognitive Disability Correlation Summary
| Measurement | Immigrants from Hong Kong | Immigrants from Guatemala |
| Minimum | 2.3% | 9.1% |
| Maximum | 22.3% | 22.9% |
| Range | 20.0% | 13.8% |
| Mean | 13.8% | 16.7% |
| Median | 14.4% | 17.4% |
| Interquartile 25% (IQ1) | 12.2% | 15.9% |
| Interquartile 75% (IQ3) | 16.1% | 18.2% |
| Interquartile Range (IQR) | 3.9% | 2.3% |
| Standard Deviation (Sample) | 3.5% | 2.6% |
| Standard Deviation (Population) | 3.5% | 2.5% |
Similar Demographics by Cognitive Disability
Demographics Similar to Immigrants from Hong Kong by Cognitive Disability
In terms of cognitive disability, the demographic groups most similar to Immigrants from Hong Kong are Immigrants from Lithuania (16.0%, a difference of 0.41%), Chinese (15.9%, a difference of 0.59%), Thai (16.1%, a difference of 0.61%), Immigrants from India (15.9%, a difference of 0.68%), and Immigrants from Ireland (16.1%, a difference of 0.72%).
| Demographics | Rating | Rank | Cognitive Disability |
| Immigrants | Taiwan | 100.0 /100 | #1 | Exceptional 15.7% |
| Immigrants | India | 100.0 /100 | #2 | Exceptional 15.9% |
| Chinese | 100.0 /100 | #3 | Exceptional 15.9% |
| Immigrants | Lithuania | 100.0 /100 | #4 | Exceptional 16.0% |
| Immigrants | Hong Kong | 100.0 /100 | #5 | Exceptional 16.0% |
| Thais | 100.0 /100 | #6 | Exceptional 16.1% |
| Immigrants | Ireland | 100.0 /100 | #7 | Exceptional 16.1% |
| Immigrants | Poland | 100.0 /100 | #8 | Exceptional 16.1% |
| Assyrians/Chaldeans/Syriacs | 100.0 /100 | #9 | Exceptional 16.2% |
| Immigrants | Scotland | 100.0 /100 | #10 | Exceptional 16.2% |
| Immigrants | Czechoslovakia | 100.0 /100 | #11 | Exceptional 16.2% |
| Maltese | 100.0 /100 | #12 | Exceptional 16.2% |
| Lithuanians | 100.0 /100 | #13 | Exceptional 16.3% |
| Immigrants | Austria | 100.0 /100 | #14 | Exceptional 16.3% |
| Immigrants | Greece | 100.0 /100 | #15 | Exceptional 16.3% |
Demographics Similar to Immigrants from Guatemala by Cognitive Disability
In terms of cognitive disability, the demographic groups most similar to Immigrants from Guatemala are Immigrants from Central America (17.7%, a difference of 0.020%), Mongolian (17.7%, a difference of 0.020%), Guatemalan (17.8%, a difference of 0.060%), Tongan (17.8%, a difference of 0.060%), and Panamanian (17.8%, a difference of 0.060%).
| Demographics | Rating | Rank | Cognitive Disability |
| Central Americans | 4.5 /100 | #222 | Tragic 17.7% |
| Alsatians | 4.5 /100 | #223 | Tragic 17.7% |
| Fijians | 3.4 /100 | #224 | Tragic 17.7% |
| Vietnamese | 3.4 /100 | #225 | Tragic 17.7% |
| Marshallese | 2.7 /100 | #226 | Tragic 17.7% |
| Immigrants | St. Vincent and the Grenadines | 2.6 /100 | #227 | Tragic 17.7% |
| Immigrants | Central America | 2.3 /100 | #228 | Tragic 17.7% |
| Immigrants | Guatemala | 2.2 /100 | #229 | Tragic 17.7% |
| Mongolians | 2.2 /100 | #230 | Tragic 17.7% |
| Guatemalans | 2.1 /100 | #231 | Tragic 17.8% |
| Tongans | 2.1 /100 | #232 | Tragic 17.8% |
| Panamanians | 2.1 /100 | #233 | Tragic 17.8% |
| Osage | 2.0 /100 | #234 | Tragic 17.8% |
| Spanish American Indians | 2.0 /100 | #235 | Tragic 17.8% |
| Immigrants | Iraq | 1.8 /100 | #236 | Tragic 17.8% |