Serbian vs Immigrants from Armenia Hearing Disability
COMPARE
Serbian
Immigrants from Armenia
Hearing Disability
Hearing Disability Comparison
Serbians
Immigrants from Armenia
3.3%
HEARING DISABILITY
2.2/ 100
METRIC RATING
236th/ 347
METRIC RANK
2.7%
HEARING DISABILITY
97.2/ 100
METRIC RATING
82nd/ 347
METRIC RANK
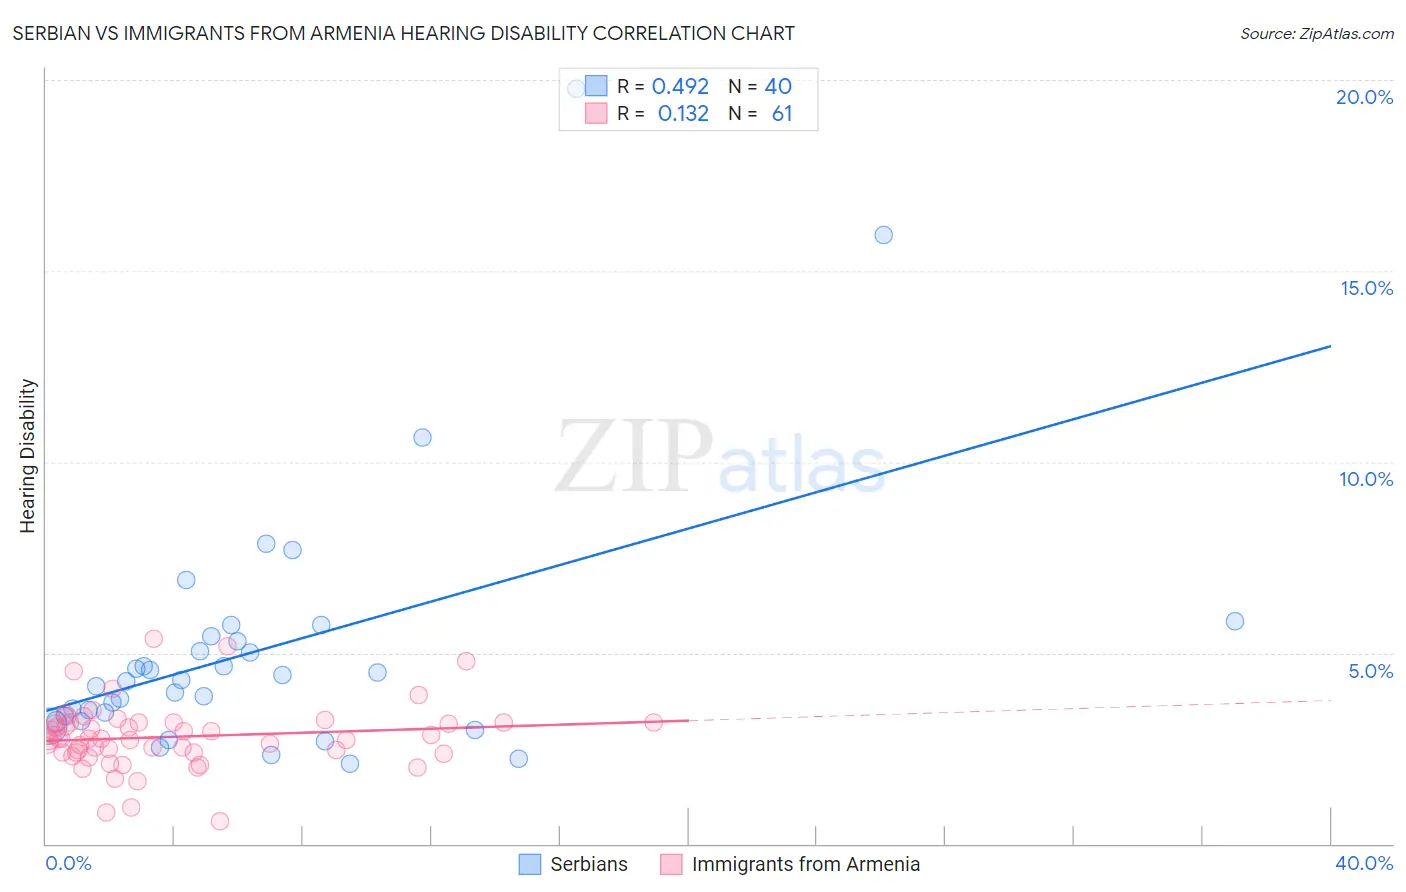
Serbian vs Immigrants from Armenia Hearing Disability Correlation Chart
The statistical analysis conducted on geographies consisting of 267,622,098 people shows a moderate positive correlation between the proportion of Serbians and percentage of population with hearing disability in the United States with a correlation coefficient (R) of 0.492 and weighted average of 3.3%. Similarly, the statistical analysis conducted on geographies consisting of 97,707,768 people shows a poor positive correlation between the proportion of Immigrants from Armenia and percentage of population with hearing disability in the United States with a correlation coefficient (R) of 0.132 and weighted average of 2.7%, a difference of 18.8%.
Hearing Disability Correlation Summary
| Measurement | Serbian | Immigrants from Armenia |
| Minimum | 2.1% | 0.60% |
| Maximum | 19.8% | 5.4% |
| Range | 17.7% | 4.8% |
| Mean | 5.1% | 2.8% |
| Median | 4.3% | 2.8% |
| Interquartile 25% (IQ1) | 3.3% | 2.4% |
| Interquartile 75% (IQ3) | 5.4% | 3.2% |
| Interquartile Range (IQR) | 2.1% | 0.77% |
| Standard Deviation (Sample) | 3.4% | 0.87% |
| Standard Deviation (Population) | 3.4% | 0.86% |
Similar Demographics by Hearing Disability
Demographics Similar to Serbians by Hearing Disability
In terms of hearing disability, the demographic groups most similar to Serbians are Guamanian/Chamorro (3.3%, a difference of 0.060%), Central American Indian (3.3%, a difference of 0.17%), Estonian (3.3%, a difference of 0.24%), Immigrants from Austria (3.3%, a difference of 0.39%), and German Russian (3.3%, a difference of 0.39%).
| Demographics | Rating | Rank | Hearing Disability |
| Maltese | 4.1 /100 | #229 | Tragic 3.2% |
| Greeks | 3.2 /100 | #230 | Tragic 3.2% |
| Luxembourgers | 2.9 /100 | #231 | Tragic 3.2% |
| Ukrainians | 2.9 /100 | #232 | Tragic 3.2% |
| Estonians | 2.4 /100 | #233 | Tragic 3.3% |
| Central American Indians | 2.3 /100 | #234 | Tragic 3.3% |
| Guamanians/Chamorros | 2.2 /100 | #235 | Tragic 3.3% |
| Serbians | 2.2 /100 | #236 | Tragic 3.3% |
| Immigrants | Austria | 1.8 /100 | #237 | Tragic 3.3% |
| German Russians | 1.8 /100 | #238 | Tragic 3.3% |
| Nepalese | 1.2 /100 | #239 | Tragic 3.3% |
| Immigrants | Netherlands | 1.1 /100 | #240 | Tragic 3.3% |
| Samoans | 1.1 /100 | #241 | Tragic 3.3% |
| Yugoslavians | 1.0 /100 | #242 | Tragic 3.3% |
| Immigrants | Western Europe | 1.0 /100 | #243 | Tragic 3.3% |
Demographics Similar to Immigrants from Armenia by Hearing Disability
In terms of hearing disability, the demographic groups most similar to Immigrants from Armenia are Immigrants from Uruguay (2.7%, a difference of 0.020%), Immigrants from Cuba (2.7%, a difference of 0.020%), Immigrants from Asia (2.7%, a difference of 0.050%), Immigrants from Argentina (2.8%, a difference of 0.21%), and Colombian (2.7%, a difference of 0.23%).
| Demographics | Rating | Rank | Hearing Disability |
| Immigrants | Saudi Arabia | 97.5 /100 | #75 | Exceptional 2.7% |
| Asians | 97.5 /100 | #76 | Exceptional 2.7% |
| Immigrants | Malaysia | 97.5 /100 | #77 | Exceptional 2.7% |
| Mongolians | 97.4 /100 | #78 | Exceptional 2.7% |
| Colombians | 97.4 /100 | #79 | Exceptional 2.7% |
| Immigrants | Asia | 97.2 /100 | #80 | Exceptional 2.7% |
| Immigrants | Uruguay | 97.2 /100 | #81 | Exceptional 2.7% |
| Immigrants | Armenia | 97.2 /100 | #82 | Exceptional 2.7% |
| Immigrants | Cuba | 97.2 /100 | #83 | Exceptional 2.7% |
| Immigrants | Argentina | 97.0 /100 | #84 | Exceptional 2.8% |
| Immigrants | Northern Africa | 96.9 /100 | #85 | Exceptional 2.8% |
| Immigrants | Iran | 96.8 /100 | #86 | Exceptional 2.8% |
| Somalis | 96.7 /100 | #87 | Exceptional 2.8% |
| Immigrants | Turkey | 96.7 /100 | #88 | Exceptional 2.8% |
| Belizeans | 96.6 /100 | #89 | Exceptional 2.8% |