Cree vs Immigrants from Armenia Child Poverty Under the Age of 5
COMPARE
Cree
Immigrants from Armenia
Child Poverty Under the Age of 5
Child Poverty Under the Age of 5 Comparison
Cree
Immigrants from Armenia
19.7%
CHILD POVERTY UNDER THE AGE OF 5
0.4/ 100
METRIC RATING
246th/ 347
METRIC RANK
17.5%
CHILD POVERTY UNDER THE AGE OF 5
38.0/ 100
METRIC RATING
185th/ 347
METRIC RANK
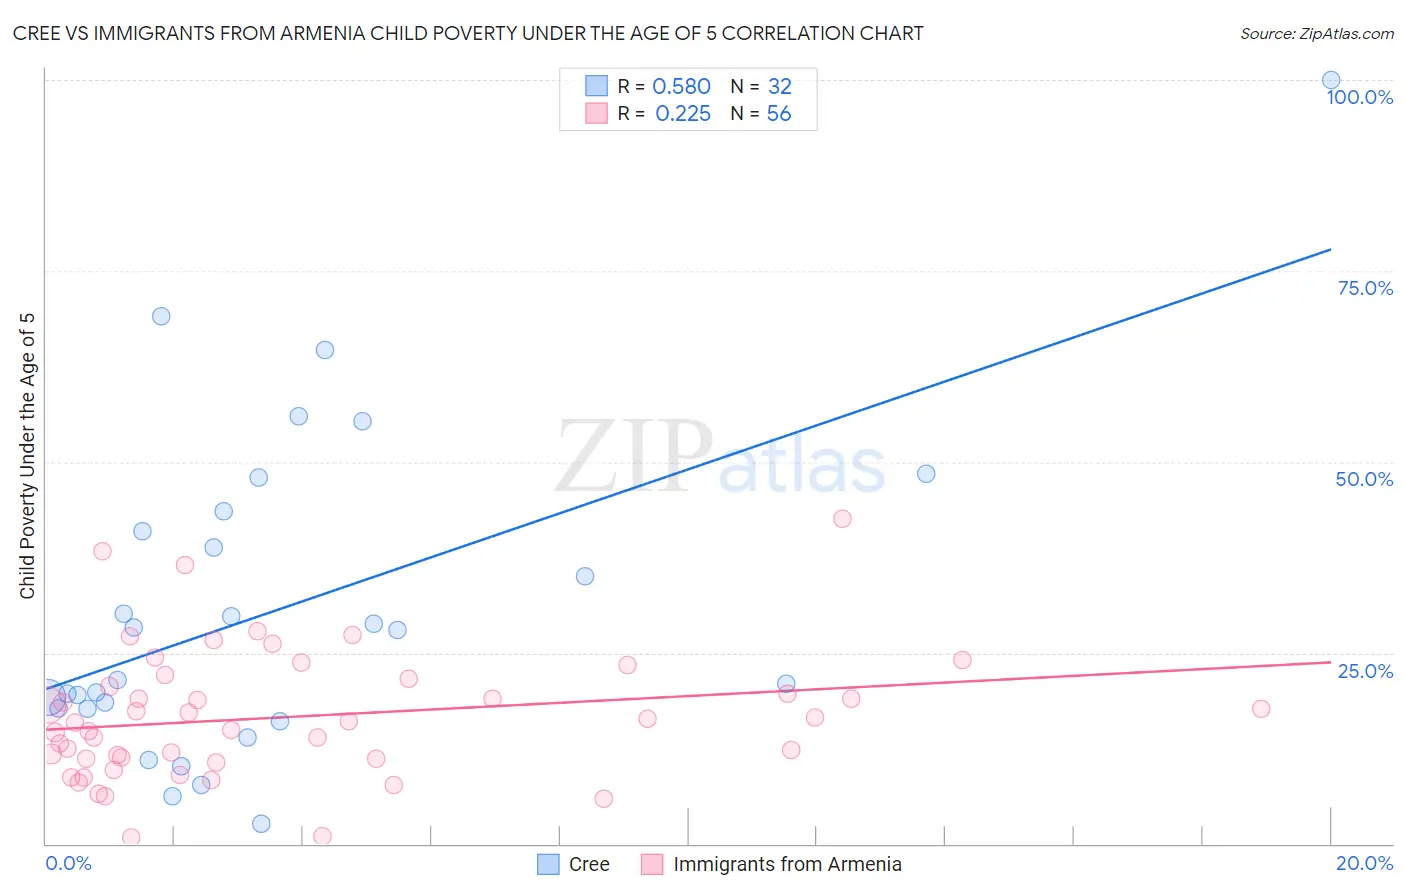
Cree vs Immigrants from Armenia Child Poverty Under the Age of 5 Correlation Chart
The statistical analysis conducted on geographies consisting of 75,401,042 people shows a substantial positive correlation between the proportion of Cree and poverty level among children under the age of 5 in the United States with a correlation coefficient (R) of 0.580 and weighted average of 19.7%. Similarly, the statistical analysis conducted on geographies consisting of 95,794,423 people shows a weak positive correlation between the proportion of Immigrants from Armenia and poverty level among children under the age of 5 in the United States with a correlation coefficient (R) of 0.225 and weighted average of 17.5%, a difference of 12.9%.
Child Poverty Under the Age of 5 Correlation Summary
| Measurement | Cree | Immigrants from Armenia |
| Minimum | 2.6% | 0.86% |
| Maximum | 100.0% | 42.6% |
| Range | 97.4% | 41.7% |
| Mean | 30.8% | 16.6% |
| Median | 24.7% | 15.9% |
| Interquartile 25% (IQ1) | 17.7% | 11.1% |
| Interquartile 75% (IQ3) | 42.2% | 21.1% |
| Interquartile Range (IQR) | 24.5% | 10.0% |
| Standard Deviation (Sample) | 21.3% | 8.5% |
| Standard Deviation (Population) | 20.9% | 8.4% |
Similar Demographics by Child Poverty Under the Age of 5
Demographics Similar to Cree by Child Poverty Under the Age of 5
In terms of child poverty under the age of 5, the demographic groups most similar to Cree are Immigrants from Western Africa (19.7%, a difference of 0.070%), Guyanese (19.7%, a difference of 0.16%), Marshallese (19.7%, a difference of 0.17%), Immigrants from Middle Africa (19.7%, a difference of 0.19%), and Nonimmigrants (19.7%, a difference of 0.24%).
| Demographics | Rating | Rank | Child Poverty Under the Age of 5 |
| Vietnamese | 0.6 /100 | #239 | Tragic 19.5% |
| Immigrants | Ecuador | 0.5 /100 | #240 | Tragic 19.6% |
| Alaska Natives | 0.5 /100 | #241 | Tragic 19.6% |
| Immigrants | Guyana | 0.5 /100 | #242 | Tragic 19.6% |
| Osage | 0.5 /100 | #243 | Tragic 19.6% |
| Immigrants | Ghana | 0.5 /100 | #244 | Tragic 19.6% |
| Immigrants | Western Africa | 0.4 /100 | #245 | Tragic 19.7% |
| Cree | 0.4 /100 | #246 | Tragic 19.7% |
| Guyanese | 0.4 /100 | #247 | Tragic 19.7% |
| Marshallese | 0.4 /100 | #248 | Tragic 19.7% |
| Immigrants | Middle Africa | 0.4 /100 | #249 | Tragic 19.7% |
| Immigrants | Nonimmigrants | 0.4 /100 | #250 | Tragic 19.7% |
| Pennsylvania Germans | 0.3 /100 | #251 | Tragic 19.8% |
| Immigrants | Nicaragua | 0.3 /100 | #252 | Tragic 19.8% |
| Mexican American Indians | 0.3 /100 | #253 | Tragic 19.9% |
Demographics Similar to Immigrants from Armenia by Child Poverty Under the Age of 5
In terms of child poverty under the age of 5, the demographic groups most similar to Immigrants from Armenia are Immigrants from Costa Rica (17.4%, a difference of 0.11%), Lebanese (17.4%, a difference of 0.25%), Arab (17.4%, a difference of 0.29%), Immigrants from Germany (17.4%, a difference of 0.32%), and Immigrants from Bosnia and Herzegovina (17.5%, a difference of 0.33%).
| Demographics | Rating | Rank | Child Poverty Under the Age of 5 |
| Immigrants | Cameroon | 42.7 /100 | #178 | Average 17.4% |
| Hawaiians | 41.5 /100 | #179 | Average 17.4% |
| South American Indians | 41.4 /100 | #180 | Average 17.4% |
| Immigrants | Germany | 41.0 /100 | #181 | Average 17.4% |
| Arabs | 40.7 /100 | #182 | Average 17.4% |
| Lebanese | 40.3 /100 | #183 | Average 17.4% |
| Immigrants | Costa Rica | 39.0 /100 | #184 | Fair 17.4% |
| Immigrants | Armenia | 38.0 /100 | #185 | Fair 17.5% |
| Immigrants | Bosnia and Herzegovina | 35.0 /100 | #186 | Fair 17.5% |
| Kenyans | 34.7 /100 | #187 | Fair 17.5% |
| Carpatho Rusyns | 33.6 /100 | #188 | Fair 17.5% |
| French | 33.6 /100 | #189 | Fair 17.5% |
| Slovaks | 29.2 /100 | #190 | Fair 17.6% |
| Immigrants | Afghanistan | 27.9 /100 | #191 | Fair 17.7% |
| Immigrants | Uruguay | 27.8 /100 | #192 | Fair 17.7% |