Immigrants from Afghanistan vs Immigrants from Armenia Hearing Disability
COMPARE
Immigrants from Afghanistan
Immigrants from Armenia
Hearing Disability
Hearing Disability Comparison
Immigrants from Afghanistan
Immigrants from Armenia
2.8%
HEARING DISABILITY
95.3/ 100
METRIC RATING
97th/ 347
METRIC RANK
2.7%
HEARING DISABILITY
97.2/ 100
METRIC RATING
82nd/ 347
METRIC RANK
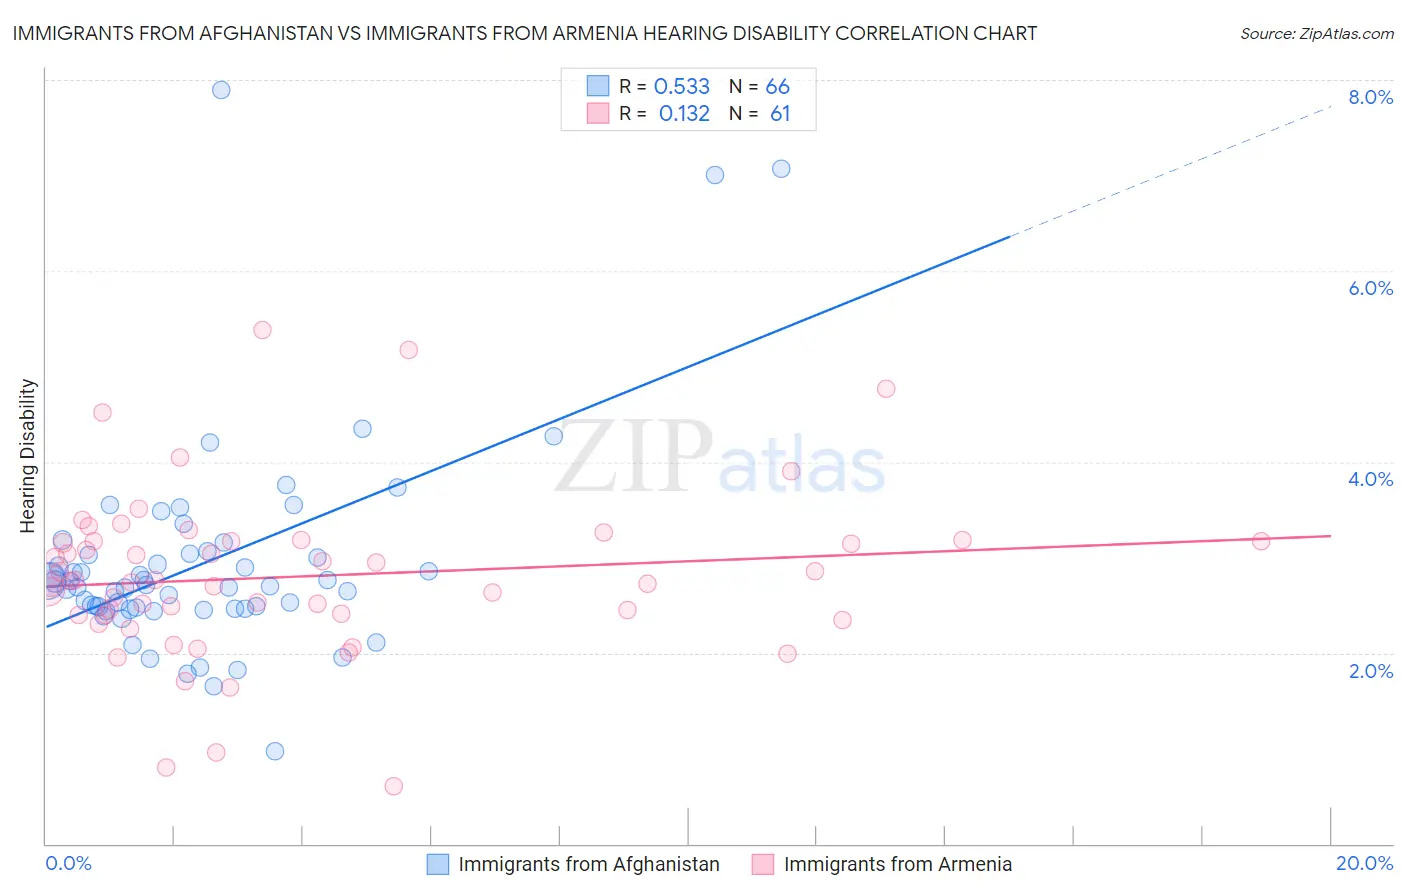
Immigrants from Afghanistan vs Immigrants from Armenia Hearing Disability Correlation Chart
The statistical analysis conducted on geographies consisting of 147,605,800 people shows a substantial positive correlation between the proportion of Immigrants from Afghanistan and percentage of population with hearing disability in the United States with a correlation coefficient (R) of 0.533 and weighted average of 2.8%. Similarly, the statistical analysis conducted on geographies consisting of 97,707,768 people shows a poor positive correlation between the proportion of Immigrants from Armenia and percentage of population with hearing disability in the United States with a correlation coefficient (R) of 0.132 and weighted average of 2.7%, a difference of 1.4%.
Hearing Disability Correlation Summary
| Measurement | Immigrants from Afghanistan | Immigrants from Armenia |
| Minimum | 0.97% | 0.60% |
| Maximum | 7.9% | 5.4% |
| Range | 6.9% | 4.8% |
| Mean | 2.9% | 2.8% |
| Median | 2.7% | 2.8% |
| Interquartile 25% (IQ1) | 2.5% | 2.4% |
| Interquartile 75% (IQ3) | 3.0% | 3.2% |
| Interquartile Range (IQR) | 0.57% | 0.77% |
| Standard Deviation (Sample) | 1.1% | 0.87% |
| Standard Deviation (Population) | 1.1% | 0.86% |
Demographics Similar to Immigrants from Afghanistan and Immigrants from Armenia by Hearing Disability
In terms of hearing disability, the demographic groups most similar to Immigrants from Afghanistan are Immigrants from Honduras (2.8%, a difference of 0.060%), Immigrants from Guatemala (2.8%, a difference of 0.10%), Immigrants from Somalia (2.8%, a difference of 0.17%), Israeli (2.8%, a difference of 0.36%), and Uruguayan (2.8%, a difference of 0.38%). Similarly, the demographic groups most similar to Immigrants from Armenia are Immigrants from Uruguay (2.7%, a difference of 0.020%), Immigrants from Cuba (2.7%, a difference of 0.020%), Immigrants from Asia (2.7%, a difference of 0.050%), Immigrants from Argentina (2.8%, a difference of 0.21%), and Colombian (2.7%, a difference of 0.23%).
| Demographics | Rating | Rank | Hearing Disability |
| Colombians | 97.4 /100 | #79 | Exceptional 2.7% |
| Immigrants | Asia | 97.2 /100 | #80 | Exceptional 2.7% |
| Immigrants | Uruguay | 97.2 /100 | #81 | Exceptional 2.7% |
| Immigrants | Armenia | 97.2 /100 | #82 | Exceptional 2.7% |
| Immigrants | Cuba | 97.2 /100 | #83 | Exceptional 2.7% |
| Immigrants | Argentina | 97.0 /100 | #84 | Exceptional 2.8% |
| Immigrants | Northern Africa | 96.9 /100 | #85 | Exceptional 2.8% |
| Immigrants | Iran | 96.8 /100 | #86 | Exceptional 2.8% |
| Somalis | 96.7 /100 | #87 | Exceptional 2.8% |
| Immigrants | Turkey | 96.7 /100 | #88 | Exceptional 2.8% |
| Belizeans | 96.6 /100 | #89 | Exceptional 2.8% |
| Immigrants | Morocco | 96.6 /100 | #90 | Exceptional 2.8% |
| Immigrants | Middle Africa | 96.5 /100 | #91 | Exceptional 2.8% |
| Iranians | 96.4 /100 | #92 | Exceptional 2.8% |
| Immigrants | Kuwait | 96.3 /100 | #93 | Exceptional 2.8% |
| Uruguayans | 95.9 /100 | #94 | Exceptional 2.8% |
| Israelis | 95.9 /100 | #95 | Exceptional 2.8% |
| Immigrants | Somalia | 95.5 /100 | #96 | Exceptional 2.8% |
| Immigrants | Afghanistan | 95.3 /100 | #97 | Exceptional 2.8% |
| Immigrants | Honduras | 95.1 /100 | #98 | Exceptional 2.8% |
| Immigrants | Guatemala | 95.1 /100 | #99 | Exceptional 2.8% |