Immigrants from Pakistan vs Bahamian Hearing Disability
COMPARE
Immigrants from Pakistan
Bahamian
Hearing Disability
Hearing Disability Comparison
Immigrants from Pakistan
Bahamians
2.6%
HEARING DISABILITY
99.6/ 100
METRIC RATING
34th/ 347
METRIC RANK
2.9%
HEARING DISABILITY
88.6/ 100
METRIC RATING
124th/ 347
METRIC RANK
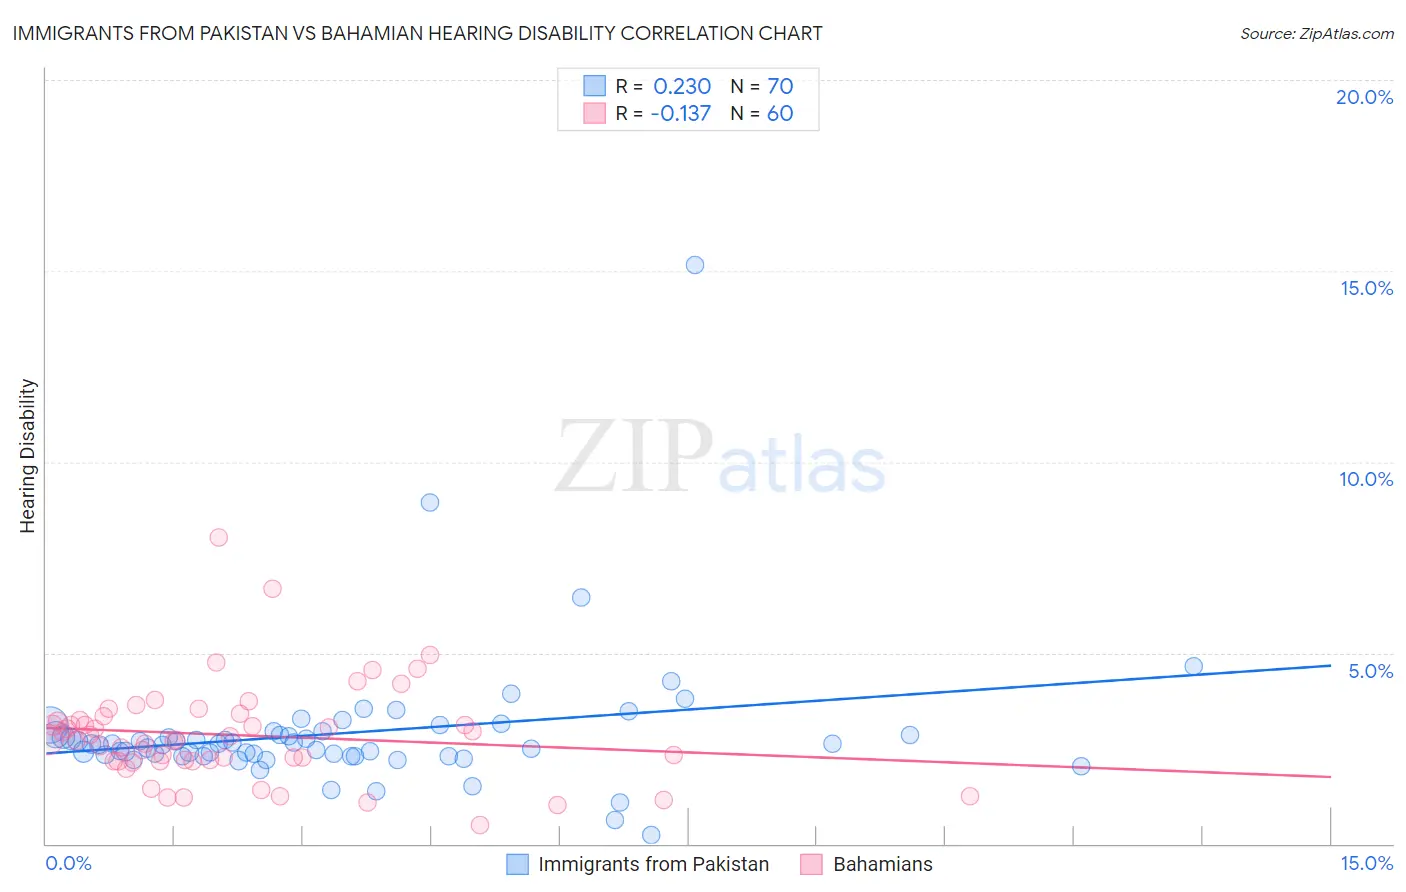
Immigrants from Pakistan vs Bahamian Hearing Disability Correlation Chart
The statistical analysis conducted on geographies consisting of 283,855,672 people shows a weak positive correlation between the proportion of Immigrants from Pakistan and percentage of population with hearing disability in the United States with a correlation coefficient (R) of 0.230 and weighted average of 2.6%. Similarly, the statistical analysis conducted on geographies consisting of 112,647,902 people shows a poor negative correlation between the proportion of Bahamians and percentage of population with hearing disability in the United States with a correlation coefficient (R) of -0.137 and weighted average of 2.9%, a difference of 9.4%.
Hearing Disability Correlation Summary
| Measurement | Immigrants from Pakistan | Bahamian |
| Minimum | 0.24% | 0.49% |
| Maximum | 15.2% | 8.0% |
| Range | 14.9% | 7.5% |
| Mean | 2.9% | 2.8% |
| Median | 2.6% | 2.7% |
| Interquartile 25% (IQ1) | 2.3% | 2.2% |
| Interquartile 75% (IQ3) | 2.9% | 3.3% |
| Interquartile Range (IQR) | 0.56% | 1.1% |
| Standard Deviation (Sample) | 1.9% | 1.3% |
| Standard Deviation (Population) | 1.9% | 1.3% |
Similar Demographics by Hearing Disability
Demographics Similar to Immigrants from Pakistan by Hearing Disability
In terms of hearing disability, the demographic groups most similar to Immigrants from Pakistan are Filipino (2.6%, a difference of 0.040%), Salvadoran (2.6%, a difference of 0.12%), Immigrants from Venezuela (2.6%, a difference of 0.30%), Okinawan (2.6%, a difference of 0.35%), and Immigrants from Western Africa (2.6%, a difference of 0.37%).
| Demographics | Rating | Rank | Hearing Disability |
| Immigrants | South Central Asia | 99.7 /100 | #27 | Exceptional 2.6% |
| Immigrants | Haiti | 99.7 /100 | #28 | Exceptional 2.6% |
| Bolivians | 99.7 /100 | #29 | Exceptional 2.6% |
| Immigrants | Caribbean | 99.7 /100 | #30 | Exceptional 2.6% |
| Immigrants | Cameroon | 99.7 /100 | #31 | Exceptional 2.6% |
| Immigrants | Venezuela | 99.7 /100 | #32 | Exceptional 2.6% |
| Filipinos | 99.6 /100 | #33 | Exceptional 2.6% |
| Immigrants | Pakistan | 99.6 /100 | #34 | Exceptional 2.6% |
| Salvadorans | 99.6 /100 | #35 | Exceptional 2.6% |
| Okinawans | 99.6 /100 | #36 | Exceptional 2.6% |
| Immigrants | Western Africa | 99.6 /100 | #37 | Exceptional 2.6% |
| Immigrants | Jamaica | 99.5 /100 | #38 | Exceptional 2.6% |
| Immigrants | China | 99.5 /100 | #39 | Exceptional 2.6% |
| Haitians | 99.5 /100 | #40 | Exceptional 2.6% |
| Immigrants | Taiwan | 99.4 /100 | #41 | Exceptional 2.6% |
Demographics Similar to Bahamians by Hearing Disability
In terms of hearing disability, the demographic groups most similar to Bahamians are Immigrants from Zaire (2.9%, a difference of 0.010%), Immigrants from Albania (2.9%, a difference of 0.030%), Liberian (2.8%, a difference of 0.10%), Cuban (2.8%, a difference of 0.19%), and Immigrants from Sudan (2.9%, a difference of 0.19%).
| Demographics | Rating | Rank | Hearing Disability |
| Immigrants | Liberia | 90.0 /100 | #117 | Excellent 2.8% |
| Zimbabweans | 89.9 /100 | #118 | Excellent 2.8% |
| Kenyans | 89.8 /100 | #119 | Excellent 2.8% |
| Jordanians | 89.5 /100 | #120 | Excellent 2.8% |
| Cubans | 89.4 /100 | #121 | Excellent 2.8% |
| Liberians | 89.0 /100 | #122 | Excellent 2.8% |
| Immigrants | Zaire | 88.6 /100 | #123 | Excellent 2.9% |
| Bahamians | 88.6 /100 | #124 | Excellent 2.9% |
| Immigrants | Albania | 88.5 /100 | #125 | Excellent 2.9% |
| Immigrants | Sudan | 87.8 /100 | #126 | Excellent 2.9% |
| South American Indians | 86.9 /100 | #127 | Excellent 2.9% |
| Immigrants | Western Asia | 86.9 /100 | #128 | Excellent 2.9% |
| Immigrants | Uganda | 86.6 /100 | #129 | Excellent 2.9% |
| Immigrants | Vietnam | 86.5 /100 | #130 | Excellent 2.9% |
| Immigrants | Kenya | 86.1 /100 | #131 | Excellent 2.9% |