Costa Rican vs Arab Disability
COMPARE
Costa Rican
Arab
Disability
Disability Comparison
Costa Ricans
Arabs
11.4%
DISABILITY
91.9/ 100
METRIC RATING
125th/ 347
METRIC RANK
11.4%
DISABILITY
89.1/ 100
METRIC RATING
133rd/ 347
METRIC RANK
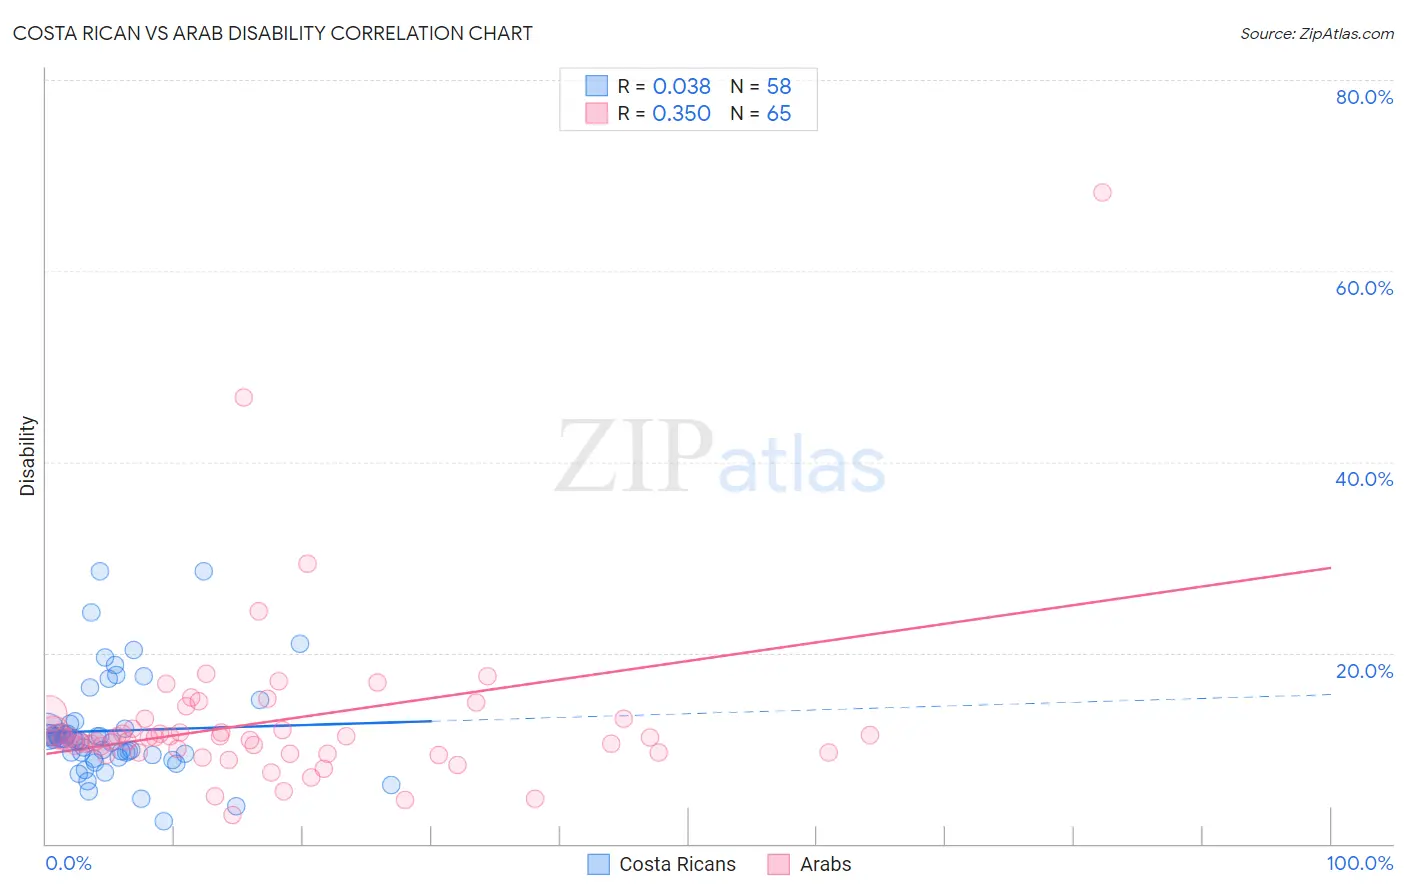
Costa Rican vs Arab Disability Correlation Chart
The statistical analysis conducted on geographies consisting of 253,574,017 people shows no correlation between the proportion of Costa Ricans and percentage of population with a disability in the United States with a correlation coefficient (R) of 0.038 and weighted average of 11.4%. Similarly, the statistical analysis conducted on geographies consisting of 486,795,543 people shows a mild positive correlation between the proportion of Arabs and percentage of population with a disability in the United States with a correlation coefficient (R) of 0.350 and weighted average of 11.4%, a difference of 0.38%.
Disability Correlation Summary
| Measurement | Costa Rican | Arab |
| Minimum | 2.4% | 3.0% |
| Maximum | 28.6% | 68.2% |
| Range | 26.2% | 65.2% |
| Mean | 11.8% | 12.9% |
| Median | 10.9% | 11.1% |
| Interquartile 25% (IQ1) | 9.3% | 9.6% |
| Interquartile 75% (IQ3) | 12.0% | 13.1% |
| Interquartile Range (IQR) | 2.7% | 3.5% |
| Standard Deviation (Sample) | 5.2% | 9.2% |
| Standard Deviation (Population) | 5.2% | 9.1% |
Demographics Similar to Costa Ricans and Arabs by Disability
In terms of disability, the demographic groups most similar to Costa Ricans are South American Indian (11.4%, a difference of 0.040%), South African (11.4%, a difference of 0.060%), Immigrants from Latvia (11.4%, a difference of 0.15%), Immigrants from Italy (11.4%, a difference of 0.22%), and Immigrants from Europe (11.4%, a difference of 0.22%). Similarly, the demographic groups most similar to Arabs are Immigrants from Africa (11.4%, a difference of 0.030%), Immigrants from Croatia (11.4%, a difference of 0.080%), Immigrants from Guyana (11.4%, a difference of 0.080%), Latvian (11.4%, a difference of 0.090%), and Ugandan (11.4%, a difference of 0.13%).
| Demographics | Rating | Rank | Disability |
| Central Americans | 93.5 /100 | #119 | Exceptional 11.4% |
| Immigrants | North Macedonia | 93.5 /100 | #120 | Exceptional 11.4% |
| Immigrants | Costa Rica | 93.4 /100 | #121 | Exceptional 11.4% |
| Brazilians | 93.3 /100 | #122 | Exceptional 11.4% |
| South Africans | 92.3 /100 | #123 | Exceptional 11.4% |
| South American Indians | 92.2 /100 | #124 | Exceptional 11.4% |
| Costa Ricans | 91.9 /100 | #125 | Exceptional 11.4% |
| Immigrants | Latvia | 90.9 /100 | #126 | Exceptional 11.4% |
| Immigrants | Italy | 90.4 /100 | #127 | Exceptional 11.4% |
| Immigrants | Europe | 90.4 /100 | #128 | Exceptional 11.4% |
| Macedonians | 90.3 /100 | #129 | Exceptional 11.4% |
| Latvians | 89.8 /100 | #130 | Excellent 11.4% |
| Immigrants | Croatia | 89.8 /100 | #131 | Excellent 11.4% |
| Immigrants | Africa | 89.3 /100 | #132 | Excellent 11.4% |
| Arabs | 89.1 /100 | #133 | Excellent 11.4% |
| Immigrants | Guyana | 88.3 /100 | #134 | Excellent 11.4% |
| Ugandans | 87.9 /100 | #135 | Excellent 11.4% |
| Immigrants | St. Vincent and the Grenadines | 87.8 /100 | #136 | Excellent 11.4% |
| Kenyans | 87.1 /100 | #137 | Excellent 11.5% |
| New Zealanders | 87.0 /100 | #138 | Excellent 11.5% |
| Ghanaians | 87.0 /100 | #139 | Excellent 11.5% |