Comanche vs Immigrants from Egypt Disability Age Over 75
COMPARE
Comanche
Immigrants from Egypt
Disability Age Over 75
Disability Age Over 75 Comparison
Comanche
Immigrants from Egypt
51.7%
DISABILITY AGE OVER 75
0.0/ 100
METRIC RATING
322nd/ 347
METRIC RANK
46.3%
DISABILITY AGE OVER 75
98.3/ 100
METRIC RATING
91st/ 347
METRIC RANK
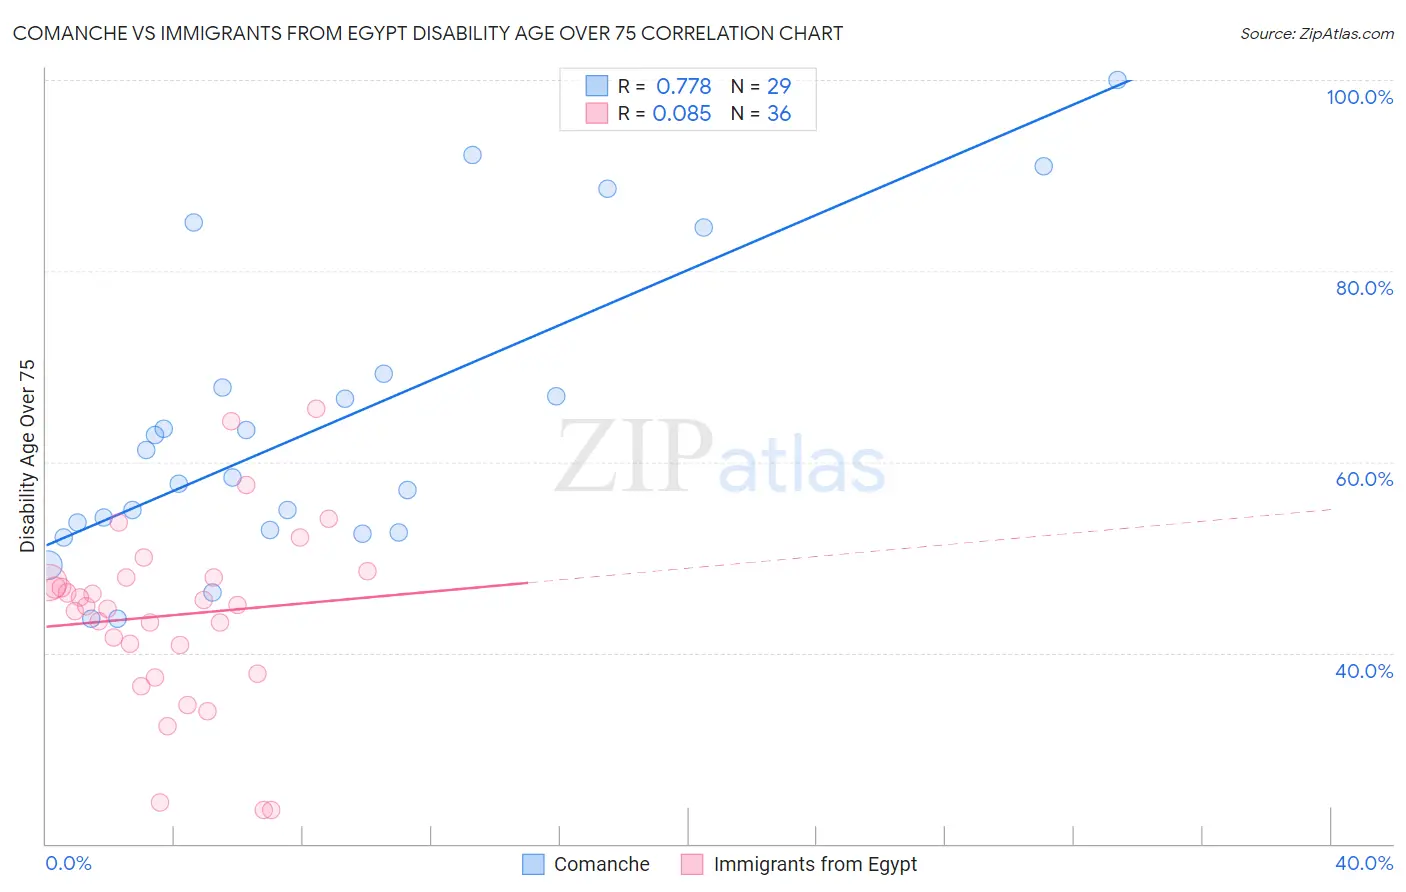
Comanche vs Immigrants from Egypt Disability Age Over 75 Correlation Chart
The statistical analysis conducted on geographies consisting of 109,684,350 people shows a strong positive correlation between the proportion of Comanche and percentage of population with a disability over the age of 75 in the United States with a correlation coefficient (R) of 0.778 and weighted average of 51.7%. Similarly, the statistical analysis conducted on geographies consisting of 245,335,222 people shows a slight positive correlation between the proportion of Immigrants from Egypt and percentage of population with a disability over the age of 75 in the United States with a correlation coefficient (R) of 0.085 and weighted average of 46.3%, a difference of 11.8%.
Disability Age Over 75 Correlation Summary
| Measurement | Comanche | Immigrants from Egypt |
| Minimum | 43.6% | 23.5% |
| Maximum | 100.0% | 65.6% |
| Range | 56.4% | 42.1% |
| Mean | 63.7% | 43.9% |
| Median | 58.4% | 45.0% |
| Interquartile 25% (IQ1) | 52.7% | 39.3% |
| Interquartile 75% (IQ3) | 68.5% | 47.9% |
| Interquartile Range (IQR) | 15.8% | 8.6% |
| Standard Deviation (Sample) | 15.5% | 9.5% |
| Standard Deviation (Population) | 15.2% | 9.4% |
Similar Demographics by Disability Age Over 75
Demographics Similar to Comanche by Disability Age Over 75
In terms of disability age over 75, the demographic groups most similar to Comanche are Paiute (51.5%, a difference of 0.34%), Dutch West Indian (51.5%, a difference of 0.34%), Creek (51.5%, a difference of 0.48%), Seminole (51.5%, a difference of 0.49%), and Immigrants from Yemen (52.0%, a difference of 0.52%).
| Demographics | Rating | Rank | Disability Age Over 75 |
| Mexicans | 0.0 /100 | #315 | Tragic 51.1% |
| Chickasaw | 0.0 /100 | #316 | Tragic 51.2% |
| Yakama | 0.0 /100 | #317 | Tragic 51.3% |
| Seminole | 0.0 /100 | #318 | Tragic 51.5% |
| Creek | 0.0 /100 | #319 | Tragic 51.5% |
| Paiute | 0.0 /100 | #320 | Tragic 51.5% |
| Dutch West Indians | 0.0 /100 | #321 | Tragic 51.5% |
| Comanche | 0.0 /100 | #322 | Tragic 51.7% |
| Immigrants | Yemen | 0.0 /100 | #323 | Tragic 52.0% |
| Menominee | 0.0 /100 | #324 | Tragic 52.3% |
| Immigrants | Cabo Verde | 0.0 /100 | #325 | Tragic 52.4% |
| Ute | 0.0 /100 | #326 | Tragic 52.6% |
| Nepalese | 0.0 /100 | #327 | Tragic 52.6% |
| Choctaw | 0.0 /100 | #328 | Tragic 52.7% |
| Alaska Natives | 0.0 /100 | #329 | Tragic 52.8% |
Demographics Similar to Immigrants from Egypt by Disability Age Over 75
In terms of disability age over 75, the demographic groups most similar to Immigrants from Egypt are Northern European (46.3%, a difference of 0.010%), Immigrants from Saudi Arabia (46.3%, a difference of 0.020%), Uruguayan (46.2%, a difference of 0.030%), German (46.3%, a difference of 0.050%), and Ugandan (46.3%, a difference of 0.050%).
| Demographics | Rating | Rank | Disability Age Over 75 |
| Immigrants | Jordan | 98.7 /100 | #84 | Exceptional 46.2% |
| Immigrants | Southern Europe | 98.6 /100 | #85 | Exceptional 46.2% |
| Romanians | 98.6 /100 | #86 | Exceptional 46.2% |
| Danes | 98.6 /100 | #87 | Exceptional 46.2% |
| Uruguayans | 98.4 /100 | #88 | Exceptional 46.2% |
| Immigrants | Saudi Arabia | 98.4 /100 | #89 | Exceptional 46.3% |
| Northern Europeans | 98.3 /100 | #90 | Exceptional 46.3% |
| Immigrants | Egypt | 98.3 /100 | #91 | Exceptional 46.3% |
| Germans | 98.2 /100 | #92 | Exceptional 46.3% |
| Ugandans | 98.2 /100 | #93 | Exceptional 46.3% |
| Albanians | 98.1 /100 | #94 | Exceptional 46.3% |
| Immigrants | Brazil | 98.0 /100 | #95 | Exceptional 46.3% |
| Immigrants | China | 98.0 /100 | #96 | Exceptional 46.3% |
| Finns | 97.9 /100 | #97 | Exceptional 46.3% |
| Immigrants | Japan | 97.8 /100 | #98 | Exceptional 46.3% |