Immigrants from Eastern Africa vs Slavic Disability Age Over 75
COMPARE
Immigrants from Eastern Africa
Slavic
Disability Age Over 75
Disability Age Over 75 Comparison
Immigrants from Eastern Africa
Slavs
47.2%
DISABILITY AGE OVER 75
65.5/ 100
METRIC RATING
163rd/ 347
METRIC RANK
46.1%
DISABILITY AGE OVER 75
98.9/ 100
METRIC RATING
76th/ 347
METRIC RANK
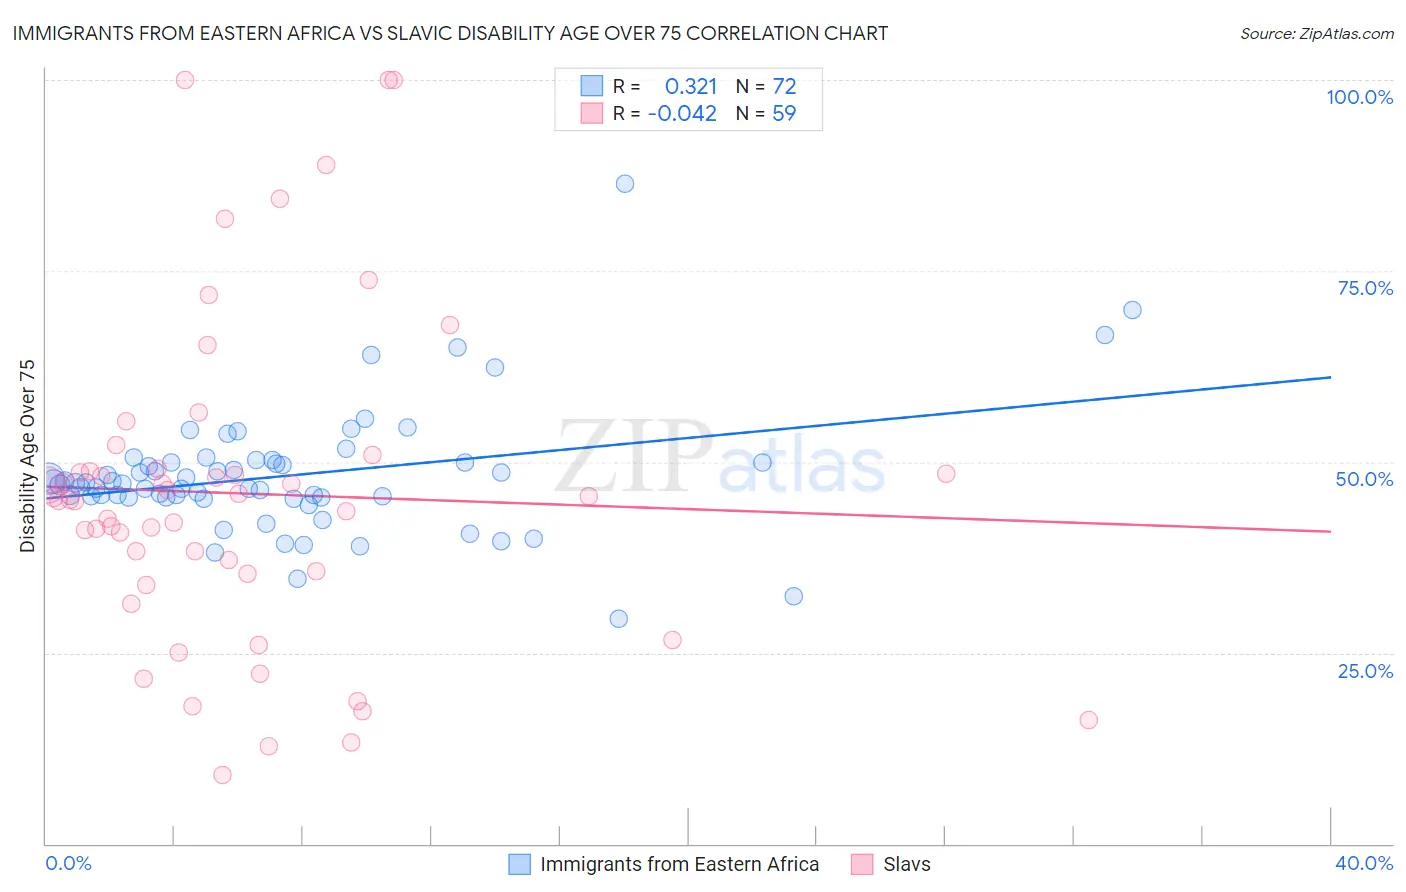
Immigrants from Eastern Africa vs Slavic Disability Age Over 75 Correlation Chart
The statistical analysis conducted on geographies consisting of 354,505,709 people shows a mild positive correlation between the proportion of Immigrants from Eastern Africa and percentage of population with a disability over the age of 75 in the United States with a correlation coefficient (R) of 0.321 and weighted average of 47.2%. Similarly, the statistical analysis conducted on geographies consisting of 270,699,743 people shows no correlation between the proportion of Slavs and percentage of population with a disability over the age of 75 in the United States with a correlation coefficient (R) of -0.042 and weighted average of 46.1%, a difference of 2.2%.
Disability Age Over 75 Correlation Summary
| Measurement | Immigrants from Eastern Africa | Slavic |
| Minimum | 29.5% | 9.0% |
| Maximum | 86.5% | 100.0% |
| Range | 57.0% | 91.0% |
| Mean | 48.2% | 45.9% |
| Median | 47.2% | 45.1% |
| Interquartile 25% (IQ1) | 45.3% | 35.3% |
| Interquartile 75% (IQ3) | 50.0% | 49.1% |
| Interquartile Range (IQR) | 4.7% | 13.8% |
| Standard Deviation (Sample) | 8.3% | 21.2% |
| Standard Deviation (Population) | 8.2% | 21.0% |
Similar Demographics by Disability Age Over 75
Demographics Similar to Immigrants from Eastern Africa by Disability Age Over 75
In terms of disability age over 75, the demographic groups most similar to Immigrants from Eastern Africa are Pennsylvania German (47.2%, a difference of 0.010%), French (47.2%, a difference of 0.020%), Immigrants from Zimbabwe (47.2%, a difference of 0.030%), Immigrants from Sierra Leone (47.2%, a difference of 0.030%), and Immigrants from Middle Africa (47.1%, a difference of 0.070%).
| Demographics | Rating | Rank | Disability Age Over 75 |
| Arabs | 73.3 /100 | #156 | Good 47.1% |
| Bhutanese | 72.6 /100 | #157 | Good 47.1% |
| Immigrants | Guyana | 71.9 /100 | #158 | Good 47.1% |
| Immigrants | Morocco | 71.4 /100 | #159 | Good 47.1% |
| Immigrants | Middle Africa | 68.3 /100 | #160 | Good 47.1% |
| South American Indians | 68.1 /100 | #161 | Good 47.1% |
| Pennsylvania Germans | 66.0 /100 | #162 | Good 47.2% |
| Immigrants | Eastern Africa | 65.5 /100 | #163 | Good 47.2% |
| French | 64.6 /100 | #164 | Good 47.2% |
| Immigrants | Zimbabwe | 64.4 /100 | #165 | Good 47.2% |
| Immigrants | Sierra Leone | 64.4 /100 | #166 | Good 47.2% |
| Moroccans | 62.9 /100 | #167 | Good 47.2% |
| Kenyans | 58.8 /100 | #168 | Average 47.2% |
| Celtics | 58.7 /100 | #169 | Average 47.2% |
| German Russians | 56.2 /100 | #170 | Average 47.3% |
Demographics Similar to Slavs by Disability Age Over 75
In terms of disability age over 75, the demographic groups most similar to Slavs are Serbian (46.1%, a difference of 0.010%), Immigrants from Eastern Asia (46.2%, a difference of 0.040%), Egyptian (46.1%, a difference of 0.050%), Immigrants from Western Europe (46.2%, a difference of 0.050%), and Cambodian (46.1%, a difference of 0.090%).
| Demographics | Rating | Rank | Disability Age Over 75 |
| Immigrants | Romania | 99.3 /100 | #69 | Exceptional 46.0% |
| Jordanians | 99.2 /100 | #70 | Exceptional 46.1% |
| Immigrants | Sri Lanka | 99.2 /100 | #71 | Exceptional 46.1% |
| Immigrants | Hungary | 99.1 /100 | #72 | Exceptional 46.1% |
| Cambodians | 99.1 /100 | #73 | Exceptional 46.1% |
| Egyptians | 99.0 /100 | #74 | Exceptional 46.1% |
| Serbians | 99.0 /100 | #75 | Exceptional 46.1% |
| Slavs | 98.9 /100 | #76 | Exceptional 46.1% |
| Immigrants | Eastern Asia | 98.9 /100 | #77 | Exceptional 46.2% |
| Immigrants | Western Europe | 98.8 /100 | #78 | Exceptional 46.2% |
| Swiss | 98.8 /100 | #79 | Exceptional 46.2% |
| Soviet Union | 98.8 /100 | #80 | Exceptional 46.2% |
| New Zealanders | 98.8 /100 | #81 | Exceptional 46.2% |
| Immigrants | Latvia | 98.7 /100 | #82 | Exceptional 46.2% |
| Argentineans | 98.7 /100 | #83 | Exceptional 46.2% |