Immigrants from Ghana vs Slavic Disability Age Over 75
COMPARE
Immigrants from Ghana
Slavic
Disability Age Over 75
Disability Age Over 75 Comparison
Immigrants from Ghana
Slavs
47.7%
DISABILITY AGE OVER 75
19.1/ 100
METRIC RATING
205th/ 347
METRIC RANK
46.1%
DISABILITY AGE OVER 75
98.9/ 100
METRIC RATING
76th/ 347
METRIC RANK
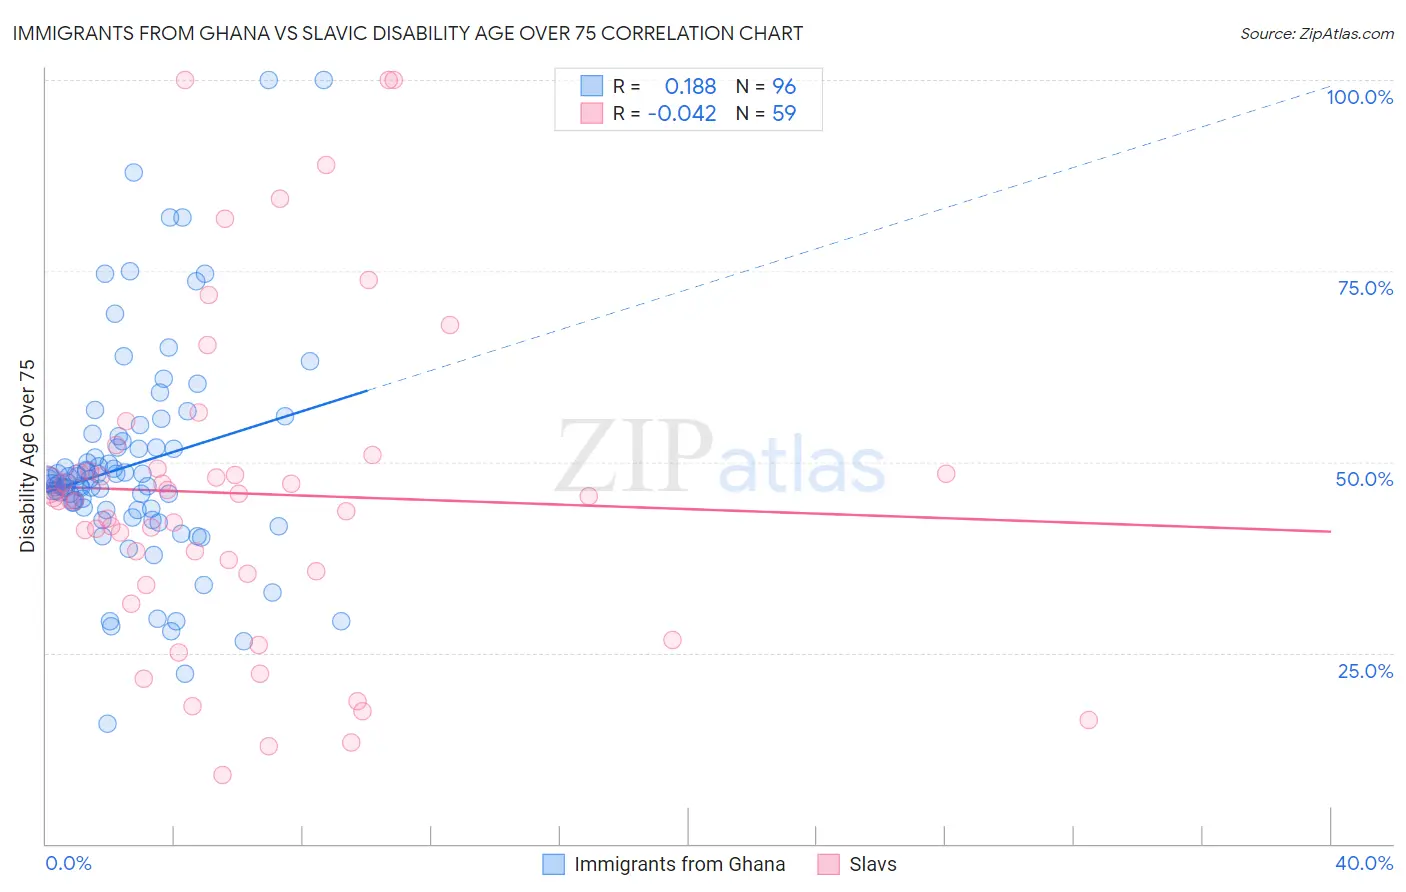
Immigrants from Ghana vs Slavic Disability Age Over 75 Correlation Chart
The statistical analysis conducted on geographies consisting of 199,494,871 people shows a poor positive correlation between the proportion of Immigrants from Ghana and percentage of population with a disability over the age of 75 in the United States with a correlation coefficient (R) of 0.188 and weighted average of 47.7%. Similarly, the statistical analysis conducted on geographies consisting of 270,699,743 people shows no correlation between the proportion of Slavs and percentage of population with a disability over the age of 75 in the United States with a correlation coefficient (R) of -0.042 and weighted average of 46.1%, a difference of 3.4%.
Disability Age Over 75 Correlation Summary
| Measurement | Immigrants from Ghana | Slavic |
| Minimum | 15.7% | 9.0% |
| Maximum | 100.0% | 100.0% |
| Range | 84.3% | 91.0% |
| Mean | 49.6% | 45.9% |
| Median | 47.4% | 45.1% |
| Interquartile 25% (IQ1) | 43.8% | 35.3% |
| Interquartile 75% (IQ3) | 52.3% | 49.1% |
| Interquartile Range (IQR) | 8.6% | 13.8% |
| Standard Deviation (Sample) | 14.4% | 21.2% |
| Standard Deviation (Population) | 14.3% | 21.0% |
Similar Demographics by Disability Age Over 75
Demographics Similar to Immigrants from Ghana by Disability Age Over 75
In terms of disability age over 75, the demographic groups most similar to Immigrants from Ghana are Jamaican (47.7%, a difference of 0.0%), Nigerian (47.7%, a difference of 0.010%), Trinidadian and Tobagonian (47.7%, a difference of 0.030%), Immigrants from Cuba (47.7%, a difference of 0.060%), and Immigrants from Bahamas (47.7%, a difference of 0.060%).
| Demographics | Rating | Rank | Disability Age Over 75 |
| Immigrants | Ukraine | 23.2 /100 | #198 | Fair 47.7% |
| Immigrants | Eritrea | 22.4 /100 | #199 | Fair 47.7% |
| Immigrants | Somalia | 21.4 /100 | #200 | Fair 47.7% |
| Immigrants | Cuba | 20.9 /100 | #201 | Fair 47.7% |
| Immigrants | Bahamas | 20.7 /100 | #202 | Fair 47.7% |
| Trinidadians and Tobagonians | 20.0 /100 | #203 | Fair 47.7% |
| Nigerians | 19.2 /100 | #204 | Poor 47.7% |
| Immigrants | Ghana | 19.1 /100 | #205 | Poor 47.7% |
| Jamaicans | 19.0 /100 | #206 | Poor 47.7% |
| Immigrants | Syria | 17.4 /100 | #207 | Poor 47.8% |
| Immigrants | Senegal | 16.9 /100 | #208 | Poor 47.8% |
| Immigrants | Indonesia | 14.2 /100 | #209 | Poor 47.8% |
| Vietnamese | 11.9 /100 | #210 | Poor 47.9% |
| Panamanians | 11.8 /100 | #211 | Poor 47.9% |
| Immigrants | Burma/Myanmar | 11.7 /100 | #212 | Poor 47.9% |
Demographics Similar to Slavs by Disability Age Over 75
In terms of disability age over 75, the demographic groups most similar to Slavs are Serbian (46.1%, a difference of 0.010%), Immigrants from Eastern Asia (46.2%, a difference of 0.040%), Egyptian (46.1%, a difference of 0.050%), Immigrants from Western Europe (46.2%, a difference of 0.050%), and Cambodian (46.1%, a difference of 0.090%).
| Demographics | Rating | Rank | Disability Age Over 75 |
| Immigrants | Romania | 99.3 /100 | #69 | Exceptional 46.0% |
| Jordanians | 99.2 /100 | #70 | Exceptional 46.1% |
| Immigrants | Sri Lanka | 99.2 /100 | #71 | Exceptional 46.1% |
| Immigrants | Hungary | 99.1 /100 | #72 | Exceptional 46.1% |
| Cambodians | 99.1 /100 | #73 | Exceptional 46.1% |
| Egyptians | 99.0 /100 | #74 | Exceptional 46.1% |
| Serbians | 99.0 /100 | #75 | Exceptional 46.1% |
| Slavs | 98.9 /100 | #76 | Exceptional 46.1% |
| Immigrants | Eastern Asia | 98.9 /100 | #77 | Exceptional 46.2% |
| Immigrants | Western Europe | 98.8 /100 | #78 | Exceptional 46.2% |
| Swiss | 98.8 /100 | #79 | Exceptional 46.2% |
| Soviet Union | 98.8 /100 | #80 | Exceptional 46.2% |
| New Zealanders | 98.8 /100 | #81 | Exceptional 46.2% |
| Immigrants | Latvia | 98.7 /100 | #82 | Exceptional 46.2% |
| Argentineans | 98.7 /100 | #83 | Exceptional 46.2% |