Colombian vs Ghanaian Hearing Disability
COMPARE
Colombian
Ghanaian
Hearing Disability
Hearing Disability Comparison
Colombians
Ghanaians
2.7%
HEARING DISABILITY
97.4/ 100
METRIC RATING
79th/ 347
METRIC RANK
2.5%
HEARING DISABILITY
99.8/ 100
METRIC RATING
21st/ 347
METRIC RANK
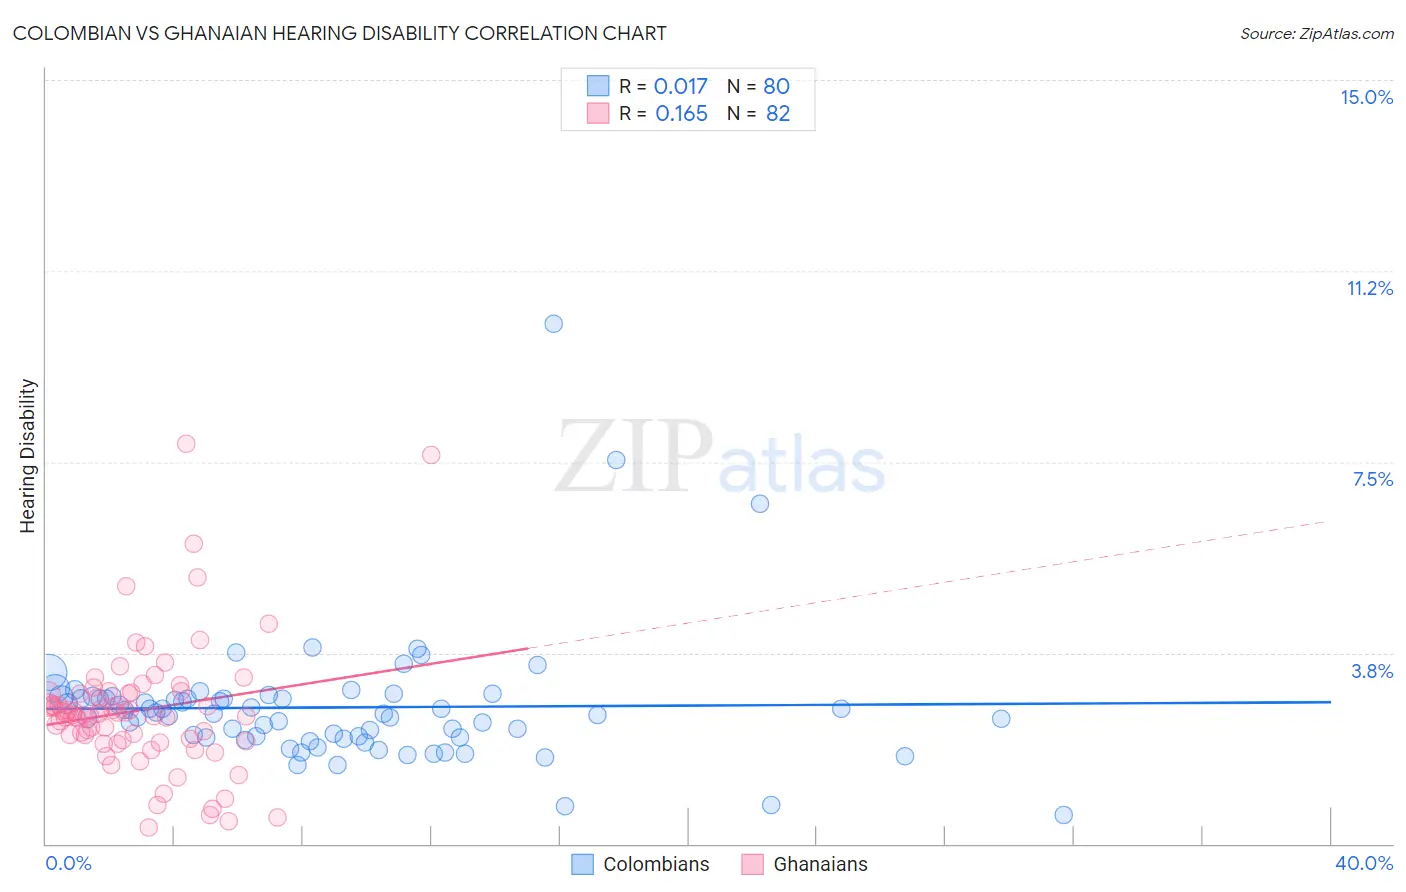
Colombian vs Ghanaian Hearing Disability Correlation Chart
The statistical analysis conducted on geographies consisting of 419,423,725 people shows no correlation between the proportion of Colombians and percentage of population with hearing disability in the United States with a correlation coefficient (R) of 0.017 and weighted average of 2.7%. Similarly, the statistical analysis conducted on geographies consisting of 190,612,767 people shows a poor positive correlation between the proportion of Ghanaians and percentage of population with hearing disability in the United States with a correlation coefficient (R) of 0.165 and weighted average of 2.5%, a difference of 7.5%.
Hearing Disability Correlation Summary
| Measurement | Colombian | Ghanaian |
| Minimum | 0.57% | 0.32% |
| Maximum | 10.2% | 7.9% |
| Range | 9.7% | 7.5% |
| Mean | 2.7% | 2.6% |
| Median | 2.6% | 2.5% |
| Interquartile 25% (IQ1) | 2.1% | 2.0% |
| Interquartile 75% (IQ3) | 2.9% | 3.0% |
| Interquartile Range (IQR) | 0.79% | 0.92% |
| Standard Deviation (Sample) | 1.3% | 1.3% |
| Standard Deviation (Population) | 1.3% | 1.3% |
Similar Demographics by Hearing Disability
Demographics Similar to Colombians by Hearing Disability
In terms of hearing disability, the demographic groups most similar to Colombians are Mongolian (2.7%, a difference of 0.020%), Immigrants from Malaysia (2.7%, a difference of 0.060%), Asian (2.7%, a difference of 0.080%), Immigrants from Saudi Arabia (2.7%, a difference of 0.090%), and Immigrants from Korea (2.7%, a difference of 0.11%).
| Demographics | Rating | Rank | Hearing Disability |
| Afghans | 97.6 /100 | #72 | Exceptional 2.7% |
| Argentineans | 97.5 /100 | #73 | Exceptional 2.7% |
| Immigrants | Korea | 97.5 /100 | #74 | Exceptional 2.7% |
| Immigrants | Saudi Arabia | 97.5 /100 | #75 | Exceptional 2.7% |
| Asians | 97.5 /100 | #76 | Exceptional 2.7% |
| Immigrants | Malaysia | 97.5 /100 | #77 | Exceptional 2.7% |
| Mongolians | 97.4 /100 | #78 | Exceptional 2.7% |
| Colombians | 97.4 /100 | #79 | Exceptional 2.7% |
| Immigrants | Asia | 97.2 /100 | #80 | Exceptional 2.7% |
| Immigrants | Uruguay | 97.2 /100 | #81 | Exceptional 2.7% |
| Immigrants | Armenia | 97.2 /100 | #82 | Exceptional 2.7% |
| Immigrants | Cuba | 97.2 /100 | #83 | Exceptional 2.7% |
| Immigrants | Argentina | 97.0 /100 | #84 | Exceptional 2.8% |
| Immigrants | Northern Africa | 96.9 /100 | #85 | Exceptional 2.8% |
| Immigrants | Iran | 96.8 /100 | #86 | Exceptional 2.8% |
Demographics Similar to Ghanaians by Hearing Disability
In terms of hearing disability, the demographic groups most similar to Ghanaians are Immigrants from Sierra Leone (2.6%, a difference of 0.040%), Immigrants from Bolivia (2.5%, a difference of 0.070%), Thai (2.5%, a difference of 0.11%), Dominican (2.5%, a difference of 0.14%), and Immigrants from Nigeria (2.6%, a difference of 0.54%).
| Demographics | Rating | Rank | Hearing Disability |
| Ecuadorians | 99.9 /100 | #14 | Exceptional 2.5% |
| Barbadians | 99.9 /100 | #15 | Exceptional 2.5% |
| Immigrants | West Indies | 99.9 /100 | #16 | Exceptional 2.5% |
| Immigrants | India | 99.9 /100 | #17 | Exceptional 2.5% |
| Dominicans | 99.8 /100 | #18 | Exceptional 2.5% |
| Thais | 99.8 /100 | #19 | Exceptional 2.5% |
| Immigrants | Bolivia | 99.8 /100 | #20 | Exceptional 2.5% |
| Ghanaians | 99.8 /100 | #21 | Exceptional 2.5% |
| Immigrants | Sierra Leone | 99.8 /100 | #22 | Exceptional 2.6% |
| Immigrants | Nigeria | 99.8 /100 | #23 | Exceptional 2.6% |
| Immigrants | Ghana | 99.8 /100 | #24 | Exceptional 2.6% |
| Immigrants | El Salvador | 99.7 /100 | #25 | Exceptional 2.6% |
| Immigrants | Senegal | 99.7 /100 | #26 | Exceptional 2.6% |
| Immigrants | South Central Asia | 99.7 /100 | #27 | Exceptional 2.6% |
| Immigrants | Haiti | 99.7 /100 | #28 | Exceptional 2.6% |