Immigrants from Netherlands vs Kiowa Hearing Disability
COMPARE
Immigrants from Netherlands
Kiowa
Hearing Disability
Hearing Disability Comparison
Immigrants from Netherlands
Kiowa
3.3%
HEARING DISABILITY
1.1/ 100
METRIC RATING
240th/ 347
METRIC RANK
4.3%
HEARING DISABILITY
0.0/ 100
METRIC RATING
335th/ 347
METRIC RANK
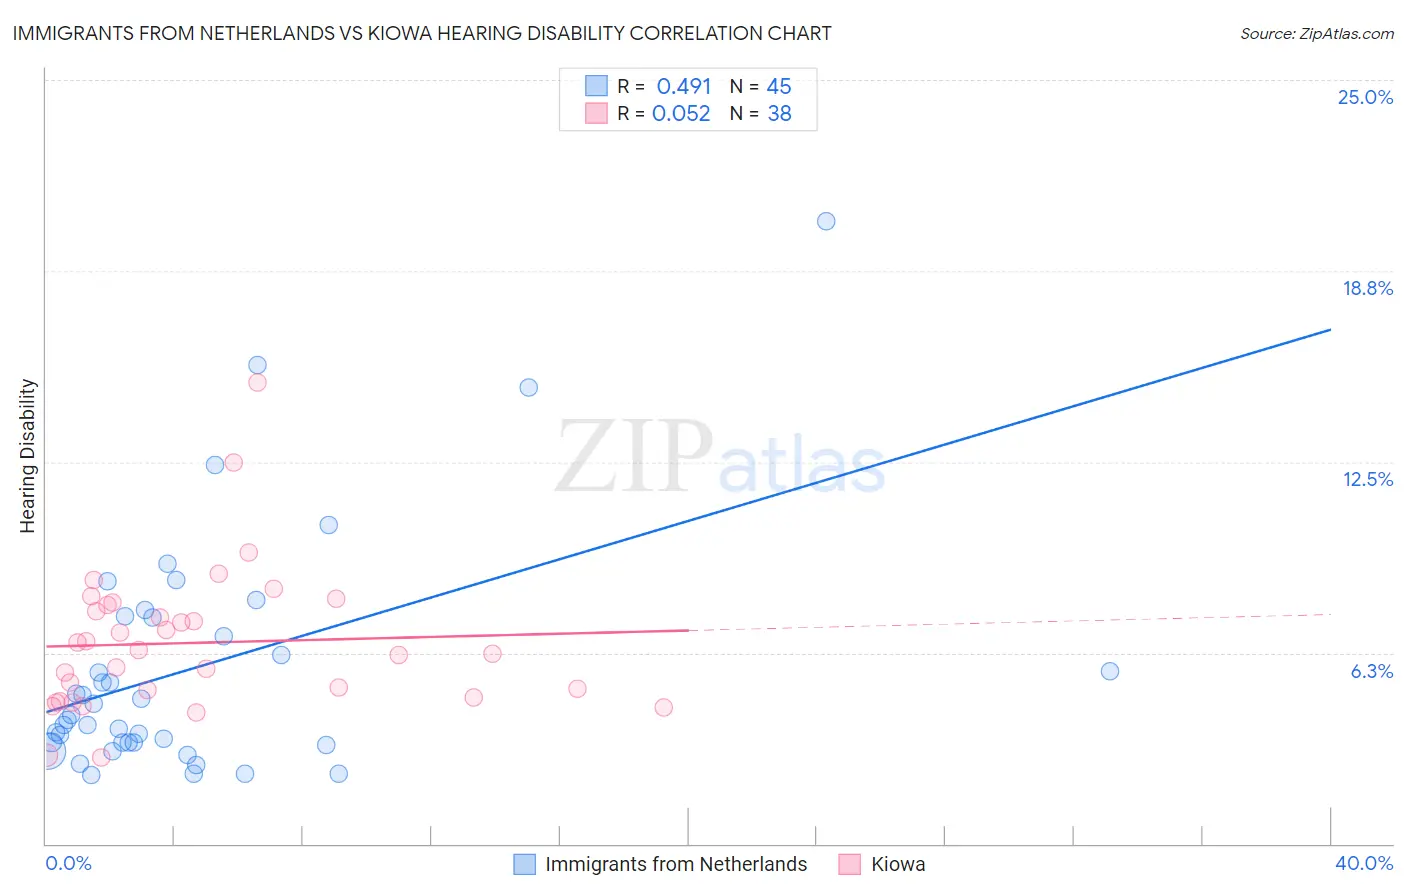
Immigrants from Netherlands vs Kiowa Hearing Disability Correlation Chart
The statistical analysis conducted on geographies consisting of 237,853,036 people shows a moderate positive correlation between the proportion of Immigrants from Netherlands and percentage of population with hearing disability in the United States with a correlation coefficient (R) of 0.491 and weighted average of 3.3%. Similarly, the statistical analysis conducted on geographies consisting of 56,096,605 people shows a slight positive correlation between the proportion of Kiowa and percentage of population with hearing disability in the United States with a correlation coefficient (R) of 0.052 and weighted average of 4.3%, a difference of 31.0%.
Hearing Disability Correlation Summary
| Measurement | Immigrants from Netherlands | Kiowa |
| Minimum | 2.3% | 2.8% |
| Maximum | 20.4% | 15.1% |
| Range | 18.1% | 12.2% |
| Mean | 5.7% | 6.6% |
| Median | 4.2% | 6.3% |
| Interquartile 25% (IQ1) | 3.3% | 4.8% |
| Interquartile 75% (IQ3) | 7.4% | 7.8% |
| Interquartile Range (IQR) | 4.1% | 3.1% |
| Standard Deviation (Sample) | 3.9% | 2.4% |
| Standard Deviation (Population) | 3.9% | 2.4% |
Similar Demographics by Hearing Disability
Demographics Similar to Immigrants from Netherlands by Hearing Disability
In terms of hearing disability, the demographic groups most similar to Immigrants from Netherlands are Samoan (3.3%, a difference of 0.070%), Nepalese (3.3%, a difference of 0.18%), Yugoslavian (3.3%, a difference of 0.18%), Immigrants from Western Europe (3.3%, a difference of 0.35%), and Assyrian/Chaldean/Syriac (3.3%, a difference of 0.43%).
| Demographics | Rating | Rank | Hearing Disability |
| Estonians | 2.4 /100 | #233 | Tragic 3.3% |
| Central American Indians | 2.3 /100 | #234 | Tragic 3.3% |
| Guamanians/Chamorros | 2.2 /100 | #235 | Tragic 3.3% |
| Serbians | 2.2 /100 | #236 | Tragic 3.3% |
| Immigrants | Austria | 1.8 /100 | #237 | Tragic 3.3% |
| German Russians | 1.8 /100 | #238 | Tragic 3.3% |
| Nepalese | 1.2 /100 | #239 | Tragic 3.3% |
| Immigrants | Netherlands | 1.1 /100 | #240 | Tragic 3.3% |
| Samoans | 1.1 /100 | #241 | Tragic 3.3% |
| Yugoslavians | 1.0 /100 | #242 | Tragic 3.3% |
| Immigrants | Western Europe | 1.0 /100 | #243 | Tragic 3.3% |
| Assyrians/Chaldeans/Syriacs | 0.9 /100 | #244 | Tragic 3.3% |
| Immigrants | Scotland | 0.8 /100 | #245 | Tragic 3.3% |
| Immigrants | England | 0.7 /100 | #246 | Tragic 3.3% |
| Lithuanians | 0.6 /100 | #247 | Tragic 3.4% |
Demographics Similar to Kiowa by Hearing Disability
In terms of hearing disability, the demographic groups most similar to Kiowa are Creek (4.4%, a difference of 0.71%), Aleut (4.3%, a difference of 1.3%), Dutch West Indian (4.3%, a difference of 1.9%), Houma (4.2%, a difference of 2.5%), and Cherokee (4.2%, a difference of 3.2%).
| Demographics | Rating | Rank | Hearing Disability |
| Tohono O'odham | 0.0 /100 | #328 | Tragic 4.2% |
| Crow | 0.0 /100 | #329 | Tragic 4.2% |
| Natives/Alaskans | 0.0 /100 | #330 | Tragic 4.2% |
| Cherokee | 0.0 /100 | #331 | Tragic 4.2% |
| Houma | 0.0 /100 | #332 | Tragic 4.2% |
| Dutch West Indians | 0.0 /100 | #333 | Tragic 4.3% |
| Aleuts | 0.0 /100 | #334 | Tragic 4.3% |
| Kiowa | 0.0 /100 | #335 | Tragic 4.3% |
| Creek | 0.0 /100 | #336 | Tragic 4.4% |
| Chickasaw | 0.0 /100 | #337 | Tragic 4.5% |
| Alaska Natives | 0.0 /100 | #338 | Tragic 4.5% |
| Choctaw | 0.0 /100 | #339 | Tragic 4.5% |
| Pueblo | 0.0 /100 | #340 | Tragic 4.6% |
| Navajo | 0.0 /100 | #341 | Tragic 4.6% |
| Tsimshian | 0.0 /100 | #342 | Tragic 4.7% |