Chinese vs Immigrants from Central America Cognitive Disability
COMPARE
Chinese
Immigrants from Central America
Cognitive Disability
Cognitive Disability Comparison
Chinese
Immigrants from Central America
15.9%
COGNITIVE DISABILITY
100.0/ 100
METRIC RATING
3rd/ 347
METRIC RANK
17.7%
COGNITIVE DISABILITY
2.3/ 100
METRIC RATING
228th/ 347
METRIC RANK
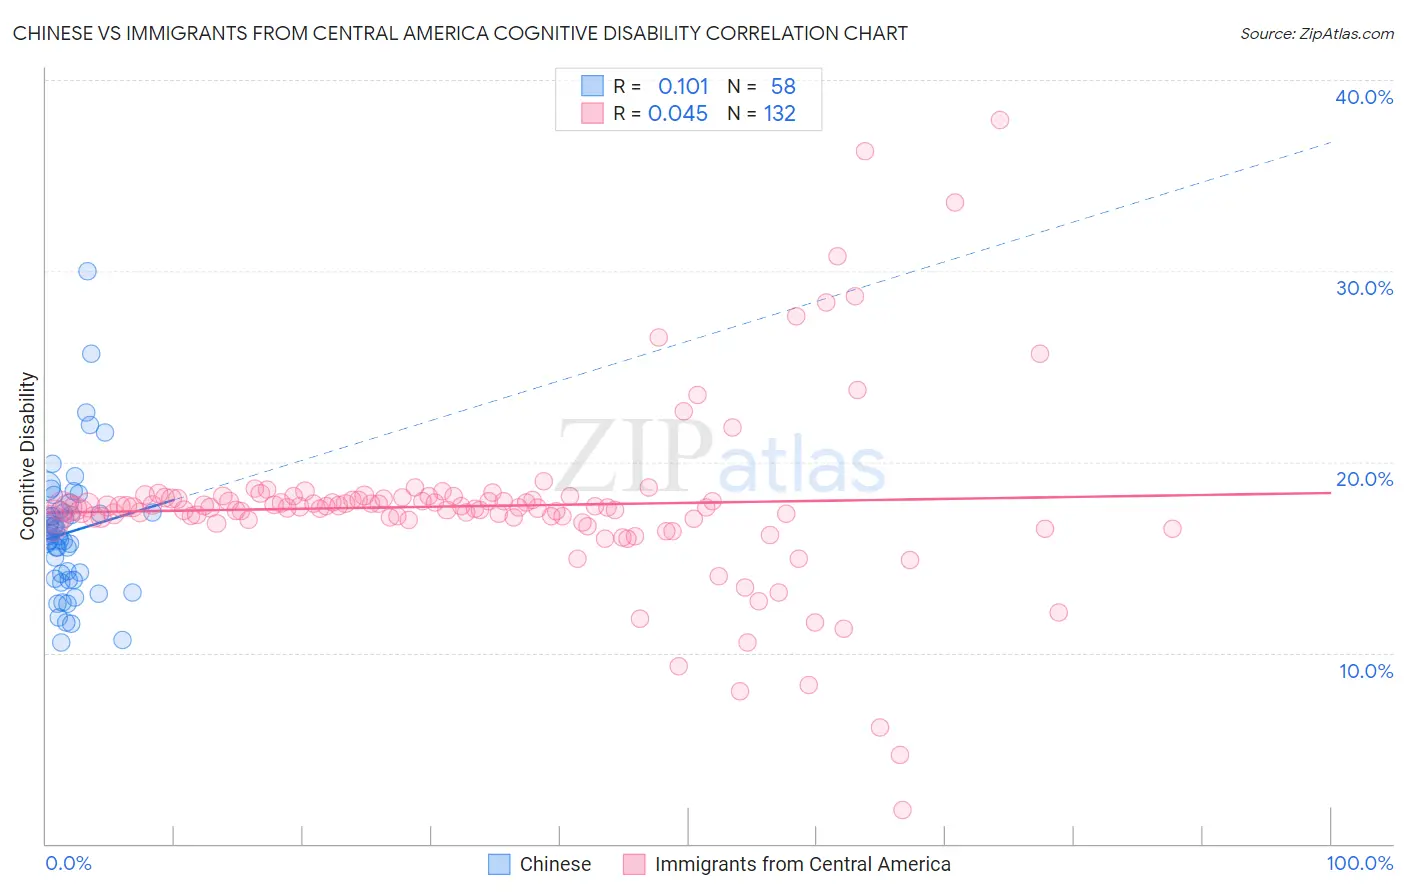
Chinese vs Immigrants from Central America Cognitive Disability Correlation Chart
The statistical analysis conducted on geographies consisting of 64,802,428 people shows a poor positive correlation between the proportion of Chinese and percentage of population with cognitive disability in the United States with a correlation coefficient (R) of 0.101 and weighted average of 15.9%. Similarly, the statistical analysis conducted on geographies consisting of 536,382,294 people shows no correlation between the proportion of Immigrants from Central America and percentage of population with cognitive disability in the United States with a correlation coefficient (R) of 0.045 and weighted average of 17.7%, a difference of 11.4%.
Cognitive Disability Correlation Summary
| Measurement | Chinese | Immigrants from Central America |
| Minimum | 10.5% | 1.8% |
| Maximum | 30.0% | 37.9% |
| Range | 19.5% | 36.2% |
| Mean | 16.3% | 17.7% |
| Median | 16.1% | 17.6% |
| Interquartile 25% (IQ1) | 13.9% | 17.0% |
| Interquartile 75% (IQ3) | 17.3% | 18.1% |
| Interquartile Range (IQR) | 3.4% | 1.1% |
| Standard Deviation (Sample) | 3.4% | 4.7% |
| Standard Deviation (Population) | 3.4% | 4.7% |
Similar Demographics by Cognitive Disability
Demographics Similar to Chinese by Cognitive Disability
In terms of cognitive disability, the demographic groups most similar to Chinese are Immigrants from India (15.9%, a difference of 0.080%), Immigrants from Lithuania (16.0%, a difference of 0.18%), Immigrants from Hong Kong (16.0%, a difference of 0.59%), Thai (16.1%, a difference of 1.2%), and Immigrants from Ireland (16.1%, a difference of 1.3%).
| Demographics | Rating | Rank | Cognitive Disability |
| Immigrants | Taiwan | 100.0 /100 | #1 | Exceptional 15.7% |
| Immigrants | India | 100.0 /100 | #2 | Exceptional 15.9% |
| Chinese | 100.0 /100 | #3 | Exceptional 15.9% |
| Immigrants | Lithuania | 100.0 /100 | #4 | Exceptional 16.0% |
| Immigrants | Hong Kong | 100.0 /100 | #5 | Exceptional 16.0% |
| Thais | 100.0 /100 | #6 | Exceptional 16.1% |
| Immigrants | Ireland | 100.0 /100 | #7 | Exceptional 16.1% |
| Immigrants | Poland | 100.0 /100 | #8 | Exceptional 16.1% |
| Assyrians/Chaldeans/Syriacs | 100.0 /100 | #9 | Exceptional 16.2% |
| Immigrants | Scotland | 100.0 /100 | #10 | Exceptional 16.2% |
| Immigrants | Czechoslovakia | 100.0 /100 | #11 | Exceptional 16.2% |
| Maltese | 100.0 /100 | #12 | Exceptional 16.2% |
| Lithuanians | 100.0 /100 | #13 | Exceptional 16.3% |
| Immigrants | Austria | 100.0 /100 | #14 | Exceptional 16.3% |
| Immigrants | Greece | 100.0 /100 | #15 | Exceptional 16.3% |
Demographics Similar to Immigrants from Central America by Cognitive Disability
In terms of cognitive disability, the demographic groups most similar to Immigrants from Central America are Immigrants from Guatemala (17.7%, a difference of 0.020%), Mongolian (17.7%, a difference of 0.050%), Immigrants from St. Vincent and the Grenadines (17.7%, a difference of 0.080%), Guatemalan (17.8%, a difference of 0.080%), and Tongan (17.8%, a difference of 0.080%).
| Demographics | Rating | Rank | Cognitive Disability |
| Moroccans | 5.9 /100 | #221 | Tragic 17.6% |
| Central Americans | 4.5 /100 | #222 | Tragic 17.7% |
| Alsatians | 4.5 /100 | #223 | Tragic 17.7% |
| Fijians | 3.4 /100 | #224 | Tragic 17.7% |
| Vietnamese | 3.4 /100 | #225 | Tragic 17.7% |
| Marshallese | 2.7 /100 | #226 | Tragic 17.7% |
| Immigrants | St. Vincent and the Grenadines | 2.6 /100 | #227 | Tragic 17.7% |
| Immigrants | Central America | 2.3 /100 | #228 | Tragic 17.7% |
| Immigrants | Guatemala | 2.2 /100 | #229 | Tragic 17.7% |
| Mongolians | 2.2 /100 | #230 | Tragic 17.7% |
| Guatemalans | 2.1 /100 | #231 | Tragic 17.8% |
| Tongans | 2.1 /100 | #232 | Tragic 17.8% |
| Panamanians | 2.1 /100 | #233 | Tragic 17.8% |
| Osage | 2.0 /100 | #234 | Tragic 17.8% |
| Spanish American Indians | 2.0 /100 | #235 | Tragic 17.8% |