Paiute vs Central American Female Disability
COMPARE
Paiute
Central American
Female Disability
Female Disability Comparison
Paiute
Central Americans
14.0%
FEMALE DISABILITY
0.0/ 100
METRIC RATING
318th/ 347
METRIC RANK
11.9%
FEMALE DISABILITY
94.2/ 100
METRIC RATING
135th/ 347
METRIC RANK
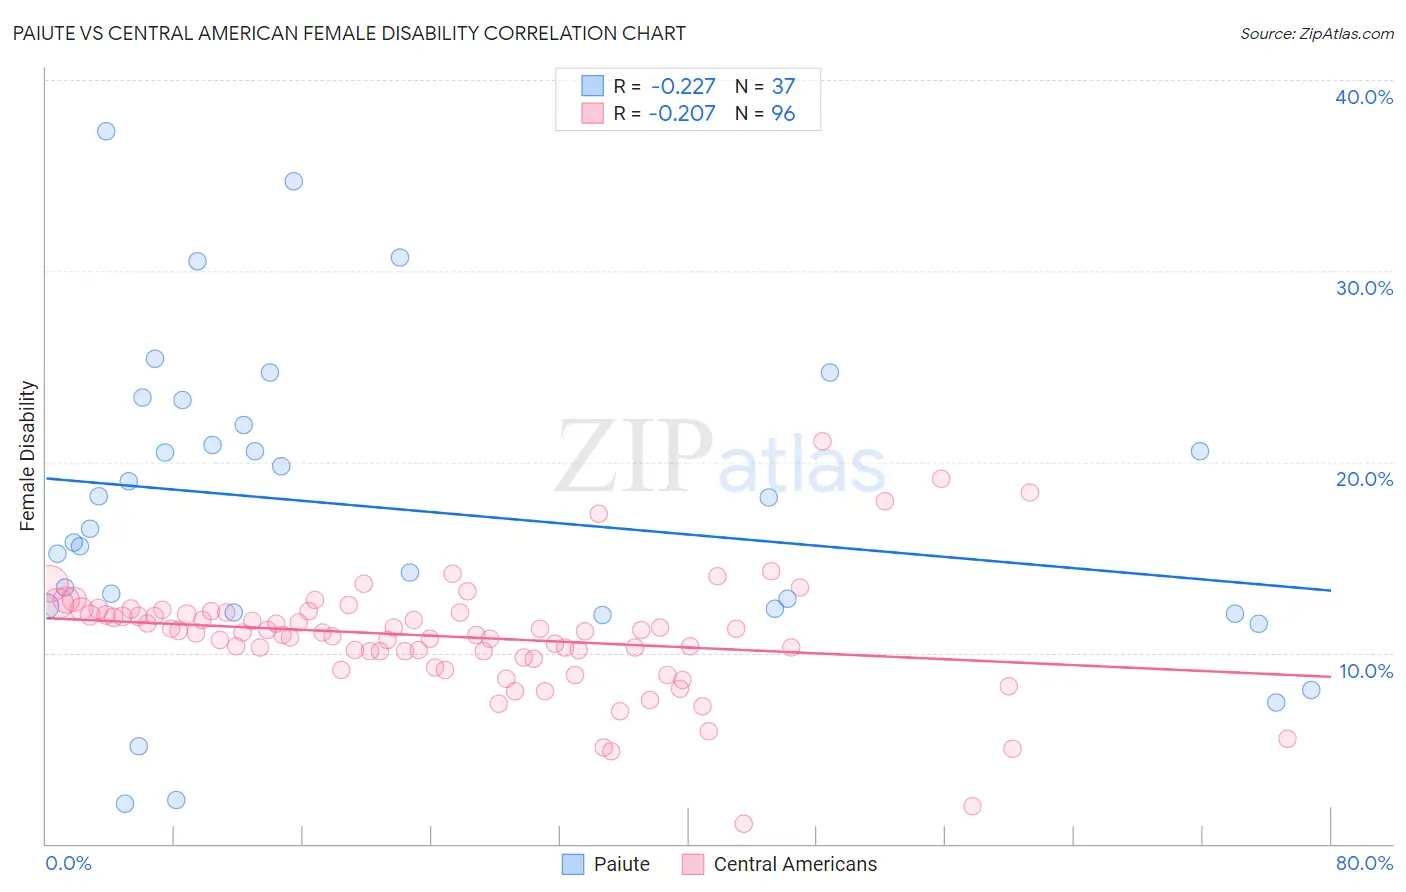
Paiute vs Central American Female Disability Correlation Chart
The statistical analysis conducted on geographies consisting of 58,394,614 people shows a weak negative correlation between the proportion of Paiute and percentage of females with a disability in the United States with a correlation coefficient (R) of -0.227 and weighted average of 14.0%. Similarly, the statistical analysis conducted on geographies consisting of 504,442,047 people shows a weak negative correlation between the proportion of Central Americans and percentage of females with a disability in the United States with a correlation coefficient (R) of -0.207 and weighted average of 11.9%, a difference of 18.0%.
Female Disability Correlation Summary
| Measurement | Paiute | Central American |
| Minimum | 2.1% | 1.0% |
| Maximum | 37.3% | 21.1% |
| Range | 35.2% | 20.0% |
| Mean | 17.5% | 10.8% |
| Median | 16.5% | 11.1% |
| Interquartile 25% (IQ1) | 12.2% | 9.9% |
| Interquartile 75% (IQ3) | 22.6% | 12.1% |
| Interquartile Range (IQR) | 10.3% | 2.2% |
| Standard Deviation (Sample) | 8.2% | 3.0% |
| Standard Deviation (Population) | 8.1% | 3.0% |
Similar Demographics by Female Disability
Demographics Similar to Paiute by Female Disability
In terms of female disability, the demographic groups most similar to Paiute are Chippewa (14.0%, a difference of 0.11%), Spanish American (14.0%, a difference of 0.22%), Iroquois (14.0%, a difference of 0.29%), Alaskan Athabascan (13.9%, a difference of 0.58%), and American (14.1%, a difference of 0.63%).
| Demographics | Rating | Rank | Female Disability |
| Hopi | 0.0 /100 | #311 | Tragic 13.7% |
| Delaware | 0.0 /100 | #312 | Tragic 13.8% |
| Blackfeet | 0.0 /100 | #313 | Tragic 13.8% |
| Puget Sound Salish | 0.0 /100 | #314 | Tragic 13.8% |
| Alaskan Athabascans | 0.0 /100 | #315 | Tragic 13.9% |
| Spanish Americans | 0.0 /100 | #316 | Tragic 14.0% |
| Chippewa | 0.0 /100 | #317 | Tragic 14.0% |
| Paiute | 0.0 /100 | #318 | Tragic 14.0% |
| Iroquois | 0.0 /100 | #319 | Tragic 14.0% |
| Americans | 0.0 /100 | #320 | Tragic 14.1% |
| Potawatomi | 0.0 /100 | #321 | Tragic 14.1% |
| Pueblo | 0.0 /100 | #322 | Tragic 14.1% |
| Blacks/African Americans | 0.0 /100 | #323 | Tragic 14.1% |
| Natives/Alaskans | 0.0 /100 | #324 | Tragic 14.1% |
| Navajo | 0.0 /100 | #325 | Tragic 14.2% |
Demographics Similar to Central Americans by Female Disability
In terms of female disability, the demographic groups most similar to Central Americans are Ugandan (11.9%, a difference of 0.030%), Immigrants from Norway (11.9%, a difference of 0.060%), Kenyan (11.9%, a difference of 0.070%), Immigrants from Nicaragua (11.9%, a difference of 0.070%), and Immigrants from Syria (11.9%, a difference of 0.080%).
| Demographics | Rating | Rank | Female Disability |
| Immigrants | Latvia | 95.6 /100 | #128 | Exceptional 11.8% |
| Macedonians | 95.5 /100 | #129 | Exceptional 11.8% |
| Nicaraguans | 95.2 /100 | #130 | Exceptional 11.9% |
| Arabs | 95.1 /100 | #131 | Exceptional 11.9% |
| Immigrants | Syria | 94.6 /100 | #132 | Exceptional 11.9% |
| Kenyans | 94.5 /100 | #133 | Exceptional 11.9% |
| Immigrants | Nicaragua | 94.5 /100 | #134 | Exceptional 11.9% |
| Central Americans | 94.2 /100 | #135 | Exceptional 11.9% |
| Ugandans | 94.0 /100 | #136 | Exceptional 11.9% |
| Immigrants | Norway | 93.8 /100 | #137 | Exceptional 11.9% |
| Ecuadorians | 93.4 /100 | #138 | Exceptional 11.9% |
| Immigrants | Hungary | 92.8 /100 | #139 | Exceptional 11.9% |
| Romanians | 91.6 /100 | #140 | Exceptional 11.9% |
| Immigrants | Ecuador | 91.5 /100 | #141 | Exceptional 11.9% |
| Immigrants | Africa | 90.0 /100 | #142 | Excellent 11.9% |