Immigrants from Eastern Europe vs Central American Female Disability
COMPARE
Immigrants from Eastern Europe
Central American
Female Disability
Female Disability Comparison
Immigrants from Eastern Europe
Central Americans
11.8%
FEMALE DISABILITY
97.2/ 100
METRIC RATING
117th/ 347
METRIC RANK
11.9%
FEMALE DISABILITY
94.2/ 100
METRIC RATING
135th/ 347
METRIC RANK
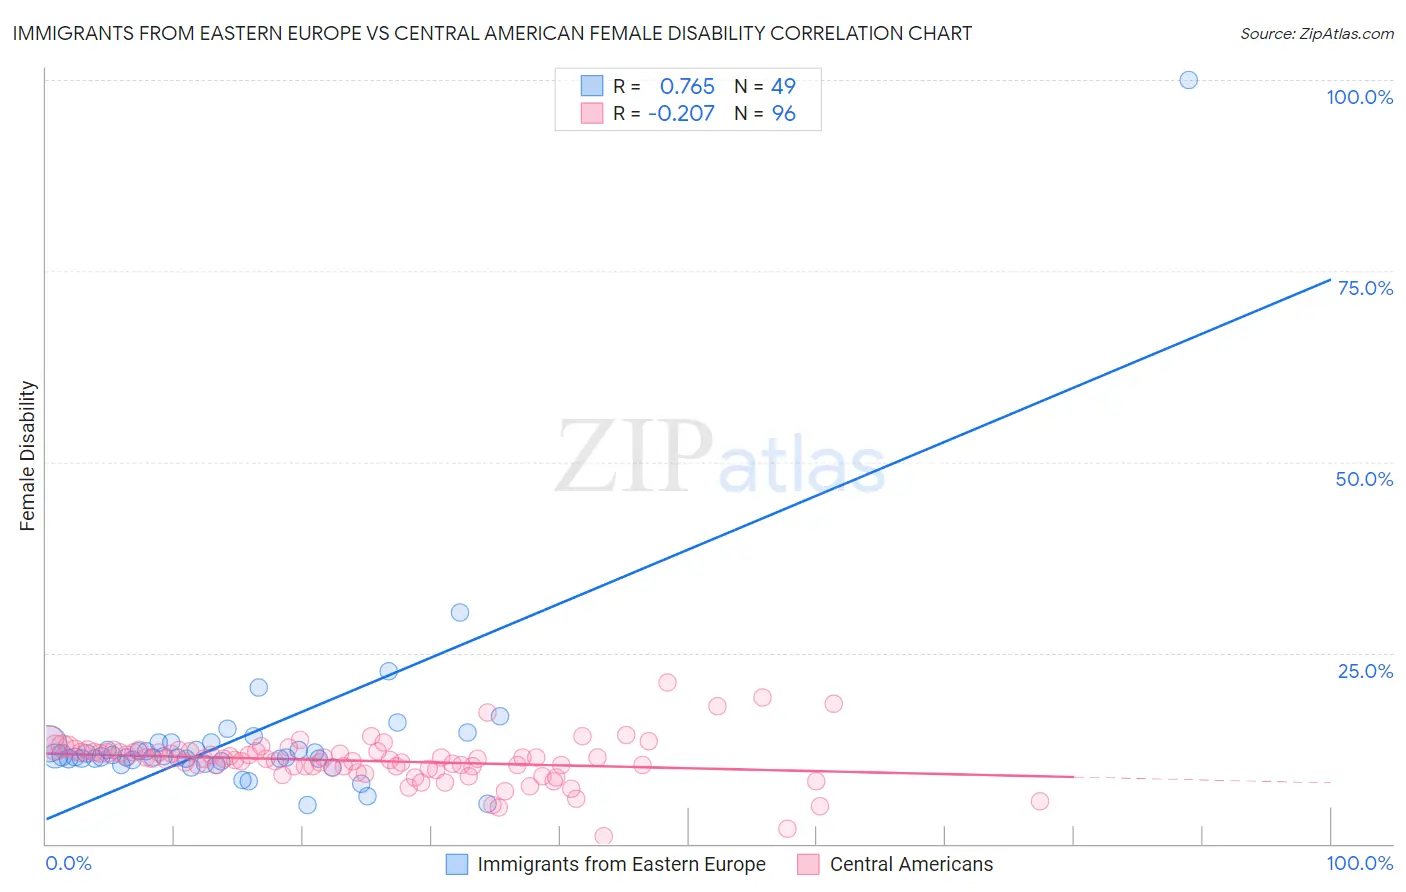
Immigrants from Eastern Europe vs Central American Female Disability Correlation Chart
The statistical analysis conducted on geographies consisting of 475,778,439 people shows a strong positive correlation between the proportion of Immigrants from Eastern Europe and percentage of females with a disability in the United States with a correlation coefficient (R) of 0.765 and weighted average of 11.8%. Similarly, the statistical analysis conducted on geographies consisting of 504,442,047 people shows a weak negative correlation between the proportion of Central Americans and percentage of females with a disability in the United States with a correlation coefficient (R) of -0.207 and weighted average of 11.9%, a difference of 0.75%.
Female Disability Correlation Summary
| Measurement | Immigrants from Eastern Europe | Central American |
| Minimum | 5.1% | 1.0% |
| Maximum | 100.0% | 21.1% |
| Range | 94.9% | 20.0% |
| Mean | 13.9% | 10.8% |
| Median | 11.4% | 11.1% |
| Interquartile 25% (IQ1) | 10.9% | 9.9% |
| Interquartile 75% (IQ3) | 13.2% | 12.1% |
| Interquartile Range (IQR) | 2.3% | 2.2% |
| Standard Deviation (Sample) | 13.2% | 3.0% |
| Standard Deviation (Population) | 13.1% | 3.0% |
Demographics Similar to Immigrants from Eastern Europe and Central Americans by Female Disability
In terms of female disability, the demographic groups most similar to Immigrants from Eastern Europe are Immigrants from Nigeria (11.8%, a difference of 0.0%), Immigrants from Uganda (11.8%, a difference of 0.010%), Immigrants from Kazakhstan (11.8%, a difference of 0.090%), Immigrants from Netherlands (11.8%, a difference of 0.11%), and Immigrants from North Macedonia (11.8%, a difference of 0.12%). Similarly, the demographic groups most similar to Central Americans are Ugandan (11.9%, a difference of 0.030%), Kenyan (11.9%, a difference of 0.070%), Immigrants from Nicaragua (11.9%, a difference of 0.070%), Immigrants from Syria (11.9%, a difference of 0.080%), and Arab (11.9%, a difference of 0.18%).
| Demographics | Rating | Rank | Female Disability |
| Immigrants | Morocco | 97.6 /100 | #116 | Exceptional 11.8% |
| Immigrants | Eastern Europe | 97.2 /100 | #117 | Exceptional 11.8% |
| Immigrants | Nigeria | 97.2 /100 | #118 | Exceptional 11.8% |
| Immigrants | Uganda | 97.2 /100 | #119 | Exceptional 11.8% |
| Immigrants | Kazakhstan | 97.0 /100 | #120 | Exceptional 11.8% |
| Immigrants | Netherlands | 96.9 /100 | #121 | Exceptional 11.8% |
| Immigrants | North Macedonia | 96.8 /100 | #122 | Exceptional 11.8% |
| Immigrants | Croatia | 96.7 /100 | #123 | Exceptional 11.8% |
| Russians | 96.5 /100 | #124 | Exceptional 11.8% |
| Immigrants | Italy | 96.4 /100 | #125 | Exceptional 11.8% |
| Immigrants | Europe | 96.2 /100 | #126 | Exceptional 11.8% |
| South American Indians | 95.8 /100 | #127 | Exceptional 11.8% |
| Immigrants | Latvia | 95.6 /100 | #128 | Exceptional 11.8% |
| Macedonians | 95.5 /100 | #129 | Exceptional 11.8% |
| Nicaraguans | 95.2 /100 | #130 | Exceptional 11.9% |
| Arabs | 95.1 /100 | #131 | Exceptional 11.9% |
| Immigrants | Syria | 94.6 /100 | #132 | Exceptional 11.9% |
| Kenyans | 94.5 /100 | #133 | Exceptional 11.9% |
| Immigrants | Nicaragua | 94.5 /100 | #134 | Exceptional 11.9% |
| Central Americans | 94.2 /100 | #135 | Exceptional 11.9% |
| Ugandans | 94.0 /100 | #136 | Exceptional 11.9% |