Bangladeshi vs Black/African American Female Disability
COMPARE
Bangladeshi
Black/African American
Female Disability
Female Disability Comparison
Bangladeshis
Blacks/African Americans
13.1%
FEMALE DISABILITY
0.0/ 100
METRIC RATING
285th/ 347
METRIC RANK
14.1%
FEMALE DISABILITY
0.0/ 100
METRIC RATING
323rd/ 347
METRIC RANK
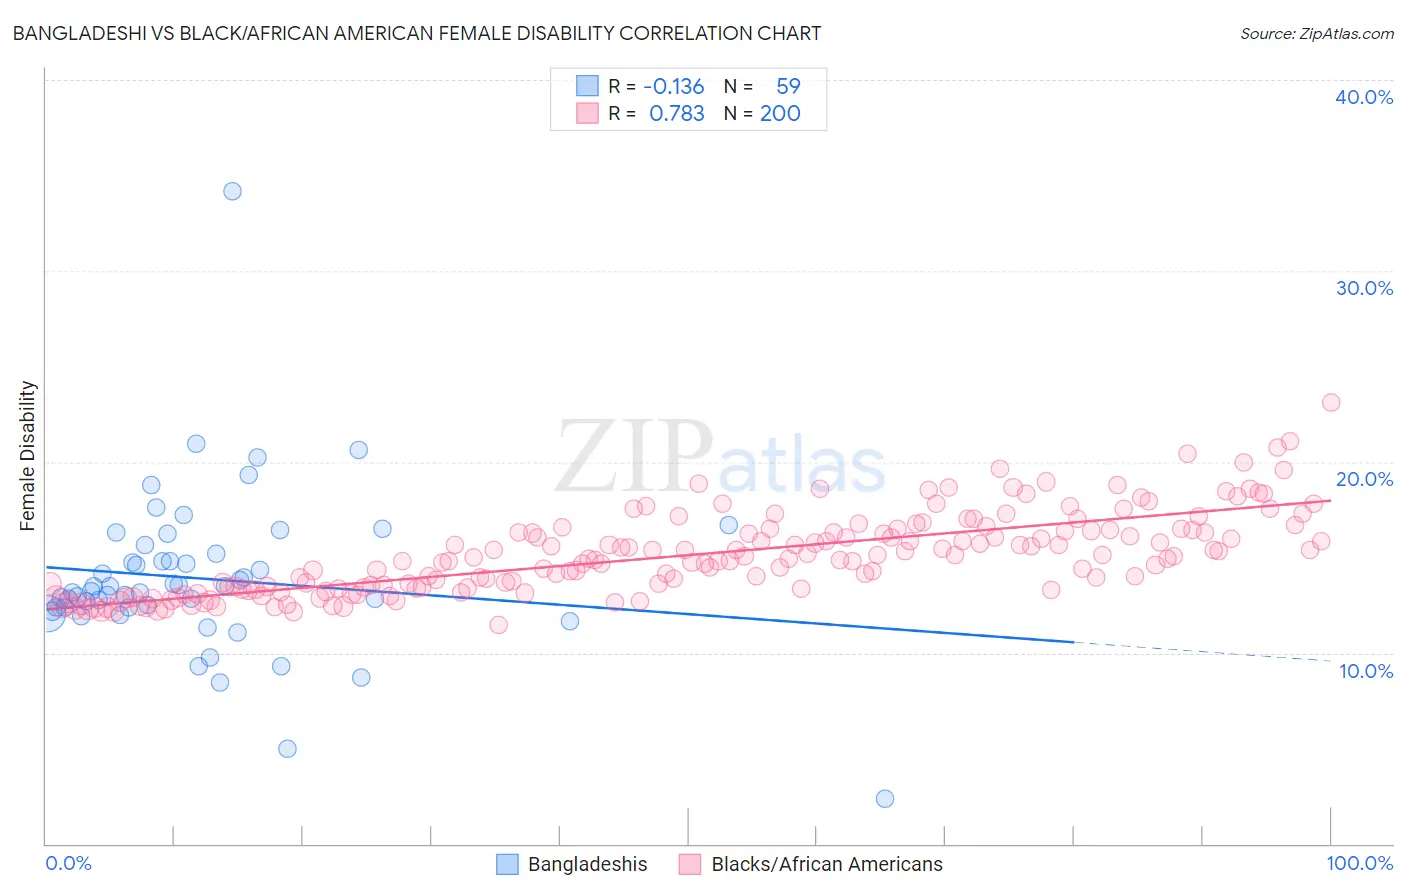
Bangladeshi vs Black/African American Female Disability Correlation Chart
The statistical analysis conducted on geographies consisting of 141,386,461 people shows a poor negative correlation between the proportion of Bangladeshis and percentage of females with a disability in the United States with a correlation coefficient (R) of -0.136 and weighted average of 13.1%. Similarly, the statistical analysis conducted on geographies consisting of 565,768,097 people shows a strong positive correlation between the proportion of Blacks/African Americans and percentage of females with a disability in the United States with a correlation coefficient (R) of 0.783 and weighted average of 14.1%, a difference of 8.0%.
Female Disability Correlation Summary
| Measurement | Bangladeshi | Black/African American |
| Minimum | 2.3% | 11.4% |
| Maximum | 34.2% | 23.1% |
| Range | 31.9% | 11.6% |
| Mean | 13.9% | 15.1% |
| Median | 13.3% | 14.9% |
| Interquartile 25% (IQ1) | 12.4% | 13.4% |
| Interquartile 75% (IQ3) | 15.2% | 16.4% |
| Interquartile Range (IQR) | 2.8% | 3.0% |
| Standard Deviation (Sample) | 4.2% | 2.1% |
| Standard Deviation (Population) | 4.2% | 2.1% |
Similar Demographics by Female Disability
Demographics Similar to Bangladeshis by Female Disability
In terms of female disability, the demographic groups most similar to Bangladeshis are Hmong (13.1%, a difference of 0.050%), Fijian (13.1%, a difference of 0.050%), English (13.1%, a difference of 0.18%), Welsh (13.1%, a difference of 0.19%), and U.S. Virgin Islander (13.1%, a difference of 0.27%).
| Demographics | Rating | Rank | Female Disability |
| Scottish | 0.1 /100 | #278 | Tragic 13.0% |
| Arapaho | 0.1 /100 | #279 | Tragic 13.0% |
| Irish | 0.1 /100 | #280 | Tragic 13.1% |
| U.S. Virgin Islanders | 0.1 /100 | #281 | Tragic 13.1% |
| Welsh | 0.0 /100 | #282 | Tragic 13.1% |
| English | 0.0 /100 | #283 | Tragic 13.1% |
| Hmong | 0.0 /100 | #284 | Tragic 13.1% |
| Bangladeshis | 0.0 /100 | #285 | Tragic 13.1% |
| Fijians | 0.0 /100 | #286 | Tragic 13.1% |
| Yaqui | 0.0 /100 | #287 | Tragic 13.2% |
| Whites/Caucasians | 0.0 /100 | #288 | Tragic 13.2% |
| Tlingit-Haida | 0.0 /100 | #289 | Tragic 13.2% |
| Immigrants | Yemen | 0.0 /100 | #290 | Tragic 13.2% |
| Shoshone | 0.0 /100 | #291 | Tragic 13.2% |
| Yakama | 0.0 /100 | #292 | Tragic 13.2% |
Demographics Similar to Blacks/African Americans by Female Disability
In terms of female disability, the demographic groups most similar to Blacks/African Americans are Native/Alaskan (14.1%, a difference of 0.020%), Navajo (14.2%, a difference of 0.16%), Pueblo (14.1%, a difference of 0.17%), Potawatomi (14.1%, a difference of 0.18%), and Comanche (14.2%, a difference of 0.27%).
| Demographics | Rating | Rank | Female Disability |
| Spanish Americans | 0.0 /100 | #316 | Tragic 14.0% |
| Chippewa | 0.0 /100 | #317 | Tragic 14.0% |
| Paiute | 0.0 /100 | #318 | Tragic 14.0% |
| Iroquois | 0.0 /100 | #319 | Tragic 14.0% |
| Americans | 0.0 /100 | #320 | Tragic 14.1% |
| Potawatomi | 0.0 /100 | #321 | Tragic 14.1% |
| Pueblo | 0.0 /100 | #322 | Tragic 14.1% |
| Blacks/African Americans | 0.0 /100 | #323 | Tragic 14.1% |
| Natives/Alaskans | 0.0 /100 | #324 | Tragic 14.1% |
| Navajo | 0.0 /100 | #325 | Tragic 14.2% |
| Comanche | 0.0 /100 | #326 | Tragic 14.2% |
| Ottawa | 0.0 /100 | #327 | Tragic 14.2% |
| Cape Verdeans | 0.0 /100 | #328 | Tragic 14.2% |
| Osage | 0.0 /100 | #329 | Tragic 14.3% |
| Yuman | 0.0 /100 | #330 | Tragic 14.5% |