Chilean vs Taiwanese Unemployment Among Ages 25 to 29 years
COMPARE
Chilean
Taiwanese
Unemployment Among Ages 25 to 29 years
Unemployment Among Ages 25 to 29 years Comparison
Chileans
Taiwanese
6.5%
UNEMPLOYMENT AMONG AGES 25 TO 29 YEARS
85.3/ 100
METRIC RATING
118th/ 347
METRIC RANK
6.1%
UNEMPLOYMENT AMONG AGES 25 TO 29 YEARS
99.5/ 100
METRIC RATING
36th/ 347
METRIC RANK
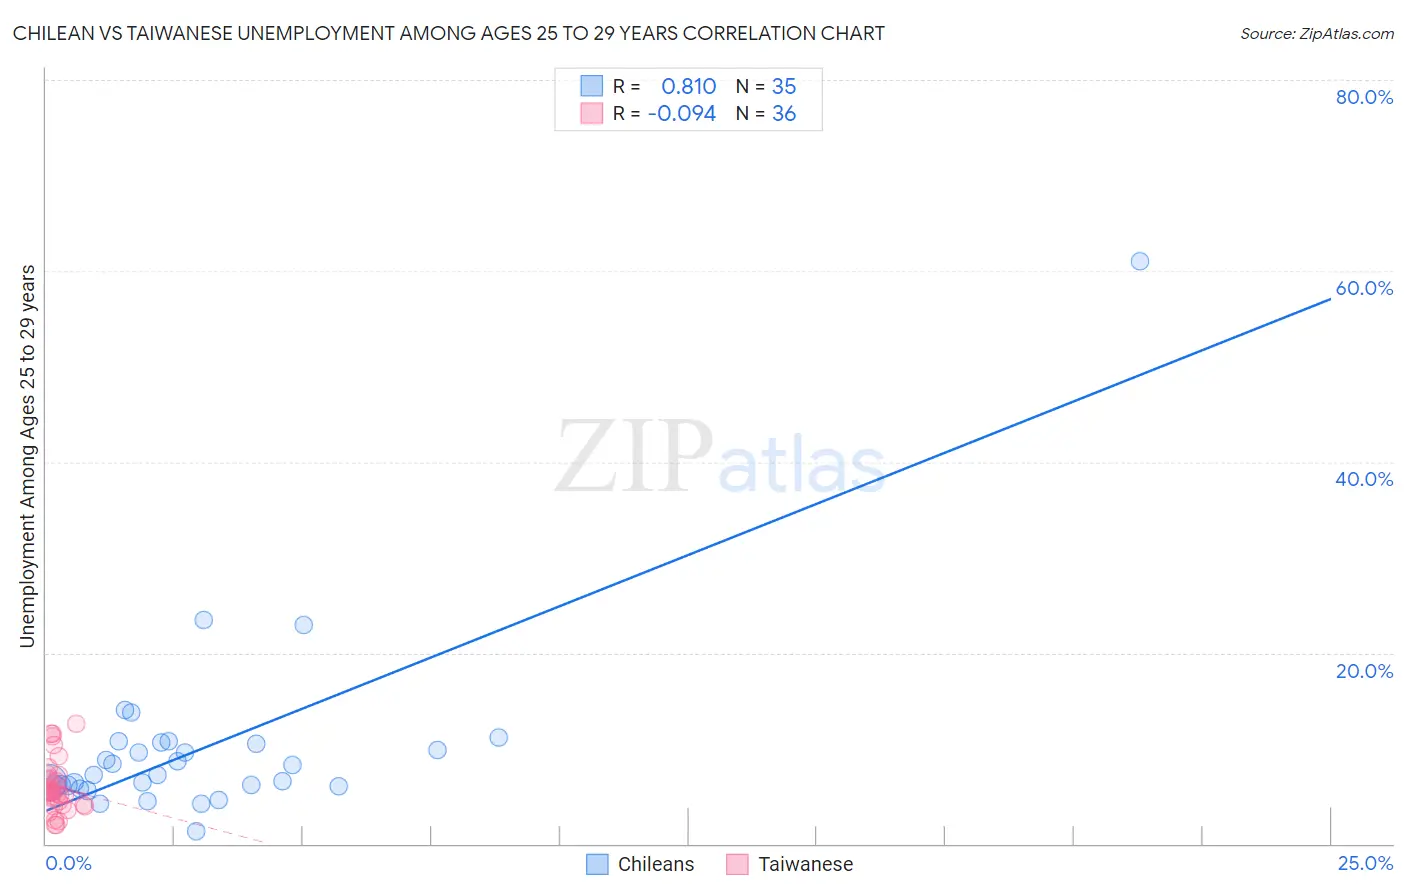
Chilean vs Taiwanese Unemployment Among Ages 25 to 29 years Correlation Chart
The statistical analysis conducted on geographies consisting of 249,568,746 people shows a very strong positive correlation between the proportion of Chileans and unemployment rate among population between the ages 25 and 29 in the United States with a correlation coefficient (R) of 0.810 and weighted average of 6.5%. Similarly, the statistical analysis conducted on geographies consisting of 31,591,120 people shows a slight negative correlation between the proportion of Taiwanese and unemployment rate among population between the ages 25 and 29 in the United States with a correlation coefficient (R) of -0.094 and weighted average of 6.1%, a difference of 5.8%.
Unemployment Among Ages 25 to 29 years Correlation Summary
| Measurement | Chilean | Taiwanese |
| Minimum | 1.3% | 2.0% |
| Maximum | 61.0% | 12.6% |
| Range | 59.7% | 10.6% |
| Mean | 10.1% | 6.0% |
| Median | 7.2% | 5.4% |
| Interquartile 25% (IQ1) | 6.1% | 4.0% |
| Interquartile 75% (IQ3) | 10.6% | 7.0% |
| Interquartile Range (IQR) | 4.5% | 3.0% |
| Standard Deviation (Sample) | 10.0% | 2.8% |
| Standard Deviation (Population) | 9.8% | 2.7% |
Similar Demographics by Unemployment Among Ages 25 to 29 years
Demographics Similar to Chileans by Unemployment Among Ages 25 to 29 years
In terms of unemployment among ages 25 to 29 years, the demographic groups most similar to Chileans are Immigrants from Uruguay (6.5%, a difference of 0.050%), Immigrants from South Africa (6.5%, a difference of 0.050%), Pakistani (6.5%, a difference of 0.070%), Immigrants from Moldova (6.5%, a difference of 0.10%), and Immigrants from Uganda (6.5%, a difference of 0.10%).
| Demographics | Rating | Rank | Unemployment Among Ages 25 to 29 years |
| Immigrants | Colombia | 87.6 /100 | #111 | Excellent 6.4% |
| Immigrants | Nicaragua | 87.5 /100 | #112 | Excellent 6.4% |
| Immigrants | Egypt | 87.1 /100 | #113 | Excellent 6.5% |
| Germans | 86.3 /100 | #114 | Excellent 6.5% |
| Macedonians | 86.1 /100 | #115 | Excellent 6.5% |
| Pakistanis | 85.9 /100 | #116 | Excellent 6.5% |
| Immigrants | Uruguay | 85.7 /100 | #117 | Excellent 6.5% |
| Chileans | 85.3 /100 | #118 | Excellent 6.5% |
| Immigrants | South Africa | 84.9 /100 | #119 | Excellent 6.5% |
| Immigrants | Moldova | 84.5 /100 | #120 | Excellent 6.5% |
| Immigrants | Uganda | 84.5 /100 | #121 | Excellent 6.5% |
| Immigrants | Belarus | 83.7 /100 | #122 | Excellent 6.5% |
| Laotians | 83.6 /100 | #123 | Excellent 6.5% |
| Arabs | 82.5 /100 | #124 | Excellent 6.5% |
| Syrians | 82.1 /100 | #125 | Excellent 6.5% |
Demographics Similar to Taiwanese by Unemployment Among Ages 25 to 29 years
In terms of unemployment among ages 25 to 29 years, the demographic groups most similar to Taiwanese are Immigrants from Zimbabwe (6.1%, a difference of 0.020%), Immigrants from Morocco (6.1%, a difference of 0.060%), Immigrants from Serbia (6.1%, a difference of 0.060%), Ethiopian (6.1%, a difference of 0.19%), and Yugoslavian (6.1%, a difference of 0.32%).
| Demographics | Rating | Rank | Unemployment Among Ages 25 to 29 years |
| Immigrants | South Central Asia | 99.7 /100 | #29 | Exceptional 6.1% |
| Bulgarians | 99.7 /100 | #30 | Exceptional 6.1% |
| Filipinos | 99.7 /100 | #31 | Exceptional 6.1% |
| Chinese | 99.6 /100 | #32 | Exceptional 6.1% |
| Yugoslavians | 99.6 /100 | #33 | Exceptional 6.1% |
| Immigrants | Morocco | 99.5 /100 | #34 | Exceptional 6.1% |
| Immigrants | Zimbabwe | 99.5 /100 | #35 | Exceptional 6.1% |
| Taiwanese | 99.5 /100 | #36 | Exceptional 6.1% |
| Immigrants | Serbia | 99.5 /100 | #37 | Exceptional 6.1% |
| Ethiopians | 99.4 /100 | #38 | Exceptional 6.1% |
| Indonesians | 99.3 /100 | #39 | Exceptional 6.1% |
| Immigrants | Kenya | 99.3 /100 | #40 | Exceptional 6.1% |
| Fijians | 99.3 /100 | #41 | Exceptional 6.1% |
| Jordanians | 99.3 /100 | #42 | Exceptional 6.1% |
| Czechs | 99.2 /100 | #43 | Exceptional 6.2% |