Chilean vs Immigrants from Cabo Verde Cognitive Disability
COMPARE
Chilean
Immigrants from Cabo Verde
Cognitive Disability
Cognitive Disability Comparison
Chileans
Immigrants from Cabo Verde
17.0%
COGNITIVE DISABILITY
89.9/ 100
METRIC RATING
140th/ 347
METRIC RANK
19.9%
COGNITIVE DISABILITY
0.0/ 100
METRIC RATING
346th/ 347
METRIC RANK
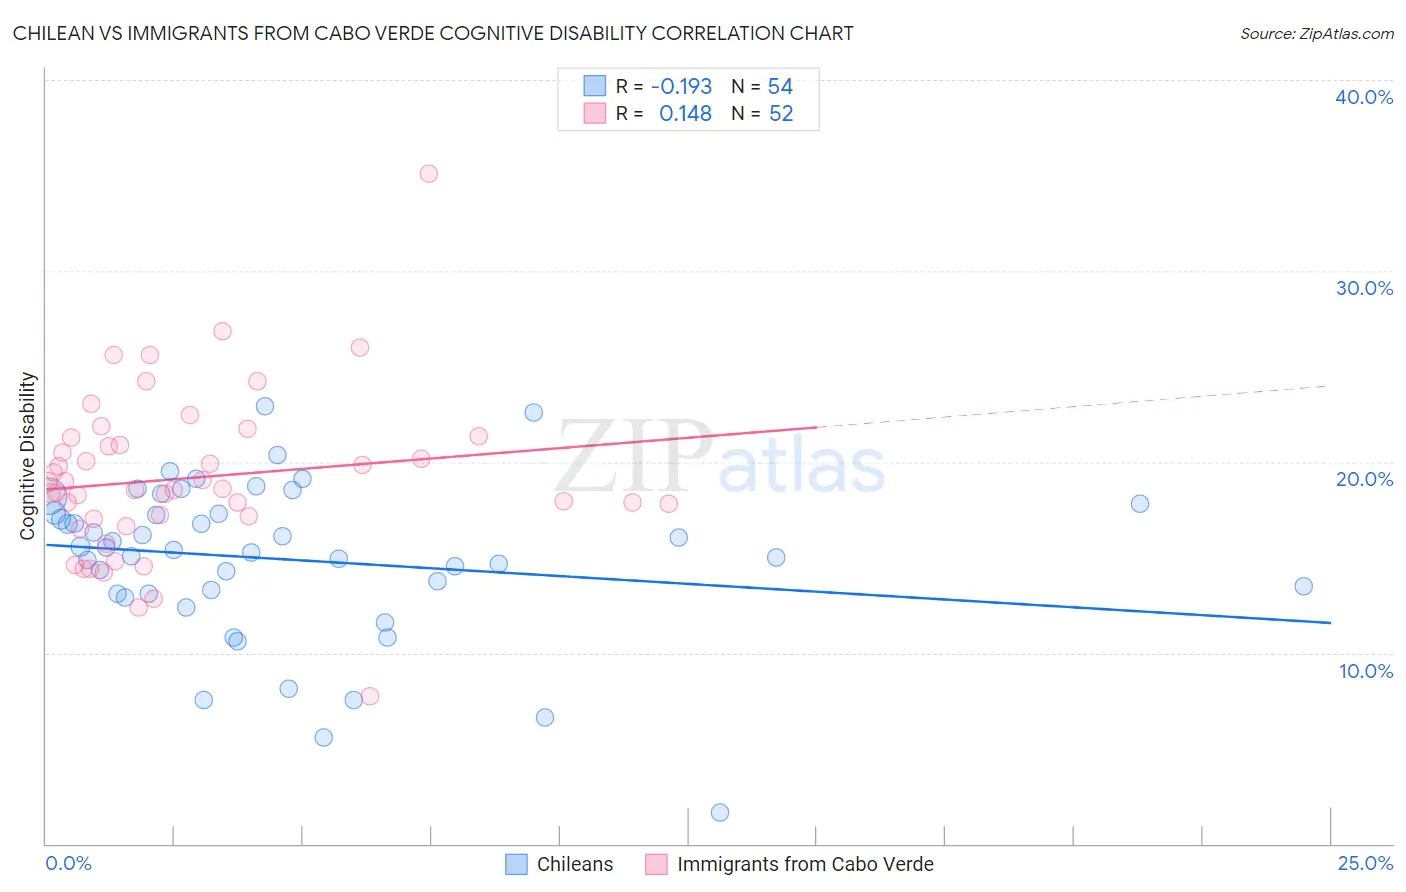
Chilean vs Immigrants from Cabo Verde Cognitive Disability Correlation Chart
The statistical analysis conducted on geographies consisting of 256,654,353 people shows a poor negative correlation between the proportion of Chileans and percentage of population with cognitive disability in the United States with a correlation coefficient (R) of -0.193 and weighted average of 17.0%. Similarly, the statistical analysis conducted on geographies consisting of 38,139,711 people shows a poor positive correlation between the proportion of Immigrants from Cabo Verde and percentage of population with cognitive disability in the United States with a correlation coefficient (R) of 0.148 and weighted average of 19.9%, a difference of 16.7%.
Cognitive Disability Correlation Summary
| Measurement | Chilean | Immigrants from Cabo Verde |
| Minimum | 1.6% | 7.7% |
| Maximum | 22.9% | 35.1% |
| Range | 21.3% | 27.4% |
| Mean | 14.9% | 19.2% |
| Median | 15.4% | 18.6% |
| Interquartile 25% (IQ1) | 13.1% | 17.1% |
| Interquartile 75% (IQ3) | 17.3% | 21.1% |
| Interquartile Range (IQR) | 4.2% | 4.0% |
| Standard Deviation (Sample) | 4.1% | 4.3% |
| Standard Deviation (Population) | 4.1% | 4.3% |
Similar Demographics by Cognitive Disability
Demographics Similar to Chileans by Cognitive Disability
In terms of cognitive disability, the demographic groups most similar to Chileans are French (17.0%, a difference of 0.0%), Aleut (17.0%, a difference of 0.0%), Carpatho Rusyn (17.0%, a difference of 0.030%), British (17.0%, a difference of 0.050%), and Immigrants from Brazil (17.0%, a difference of 0.050%).
| Demographics | Rating | Rank | Cognitive Disability |
| Immigrants | Jordan | 91.9 /100 | #133 | Exceptional 17.0% |
| Immigrants | Chile | 91.7 /100 | #134 | Exceptional 17.0% |
| Lebanese | 91.3 /100 | #135 | Exceptional 17.0% |
| Israelis | 91.0 /100 | #136 | Exceptional 17.0% |
| Immigrants | Norway | 90.9 /100 | #137 | Exceptional 17.0% |
| Welsh | 90.8 /100 | #138 | Exceptional 17.0% |
| French | 90.0 /100 | #139 | Excellent 17.0% |
| Chileans | 89.9 /100 | #140 | Excellent 17.0% |
| Aleuts | 89.9 /100 | #141 | Excellent 17.0% |
| Carpatho Rusyns | 89.6 /100 | #142 | Excellent 17.0% |
| British | 89.3 /100 | #143 | Excellent 17.0% |
| Immigrants | Brazil | 89.3 /100 | #144 | Excellent 17.0% |
| Immigrants | South Eastern Asia | 88.7 /100 | #145 | Excellent 17.0% |
| Costa Ricans | 88.0 /100 | #146 | Excellent 17.0% |
| Scotch-Irish | 85.9 /100 | #147 | Excellent 17.1% |
Demographics Similar to Immigrants from Cabo Verde by Cognitive Disability
In terms of cognitive disability, the demographic groups most similar to Immigrants from Cabo Verde are Somali (19.8%, a difference of 0.16%), Immigrants from Congo (19.7%, a difference of 0.72%), Immigrants from Somalia (20.0%, a difference of 0.73%), Immigrants from Zaire (19.4%, a difference of 2.4%), and Tohono O'odham (19.3%, a difference of 3.1%).
| Demographics | Rating | Rank | Cognitive Disability |
| Immigrants | Yemen | 0.0 /100 | #333 | Tragic 18.8% |
| Sudanese | 0.0 /100 | #334 | Tragic 18.9% |
| Senegalese | 0.0 /100 | #335 | Tragic 19.0% |
| Blacks/African Americans | 0.0 /100 | #336 | Tragic 19.0% |
| Immigrants | Saudi Arabia | 0.0 /100 | #337 | Tragic 19.1% |
| Lumbee | 0.0 /100 | #338 | Tragic 19.1% |
| Puerto Ricans | 0.0 /100 | #339 | Tragic 19.2% |
| Cape Verdeans | 0.0 /100 | #340 | Tragic 19.2% |
| Tohono O'odham | 0.0 /100 | #341 | Tragic 19.3% |
| Houma | 0.0 /100 | #342 | Tragic 19.3% |
| Immigrants | Zaire | 0.0 /100 | #343 | Tragic 19.4% |
| Immigrants | Congo | 0.0 /100 | #344 | Tragic 19.7% |
| Somalis | 0.0 /100 | #345 | Tragic 19.8% |
| Immigrants | Cabo Verde | 0.0 /100 | #346 | Tragic 19.9% |
| Immigrants | Somalia | 0.0 /100 | #347 | Tragic 20.0% |