Chickasaw vs Bahamian Ambulatory Disability
COMPARE
Chickasaw
Bahamian
Ambulatory Disability
Ambulatory Disability Comparison
Chickasaw
Bahamians
8.0%
AMBULATORY DISABILITY
0.0/ 100
METRIC RATING
335th/ 347
METRIC RANK
6.6%
AMBULATORY DISABILITY
0.2/ 100
METRIC RATING
265th/ 347
METRIC RANK
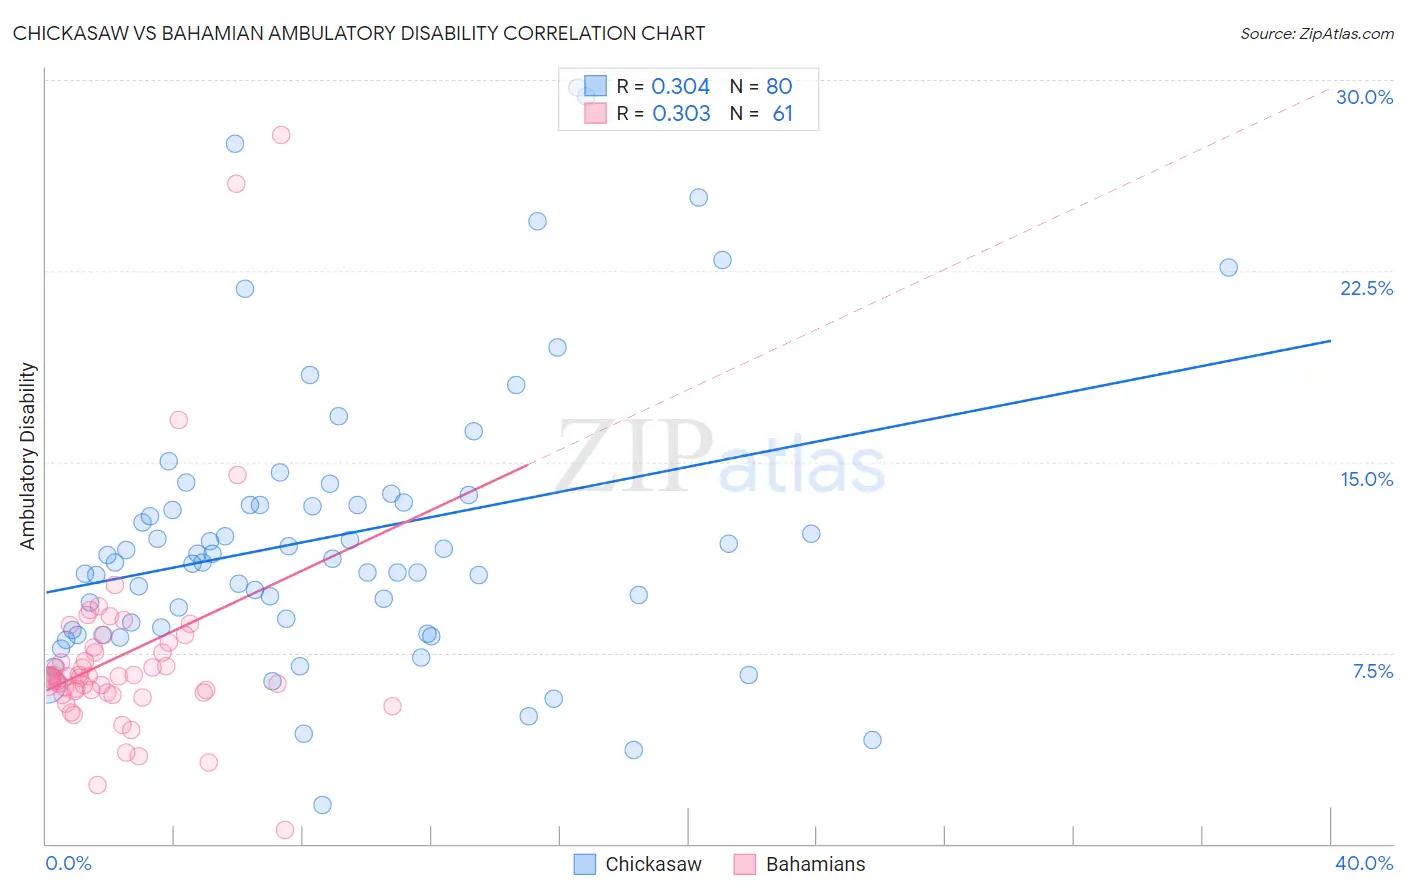
Chickasaw vs Bahamian Ambulatory Disability Correlation Chart
The statistical analysis conducted on geographies consisting of 147,679,473 people shows a mild positive correlation between the proportion of Chickasaw and percentage of population with ambulatory disability in the United States with a correlation coefficient (R) of 0.304 and weighted average of 8.0%. Similarly, the statistical analysis conducted on geographies consisting of 112,670,822 people shows a mild positive correlation between the proportion of Bahamians and percentage of population with ambulatory disability in the United States with a correlation coefficient (R) of 0.303 and weighted average of 6.6%, a difference of 21.5%.
Ambulatory Disability Correlation Summary
| Measurement | Chickasaw | Bahamian |
| Minimum | 1.5% | 0.55% |
| Maximum | 29.7% | 27.8% |
| Range | 28.2% | 27.3% |
| Mean | 12.1% | 7.4% |
| Median | 11.1% | 6.6% |
| Interquartile 25% (IQ1) | 8.4% | 5.9% |
| Interquartile 75% (IQ3) | 13.4% | 7.8% |
| Interquartile Range (IQR) | 4.9% | 1.9% |
| Standard Deviation (Sample) | 5.6% | 4.3% |
| Standard Deviation (Population) | 5.6% | 4.3% |
Similar Demographics by Ambulatory Disability
Demographics Similar to Chickasaw by Ambulatory Disability
In terms of ambulatory disability, the demographic groups most similar to Chickasaw are Seminole (8.0%, a difference of 0.070%), Yuman (7.9%, a difference of 1.1%), Dutch West Indian (8.2%, a difference of 1.7%), Cherokee (7.9%, a difference of 2.1%), and Colville (8.2%, a difference of 2.3%).
| Demographics | Rating | Rank | Ambulatory Disability |
| Hopi | 0.0 /100 | #328 | Tragic 7.6% |
| Pueblo | 0.0 /100 | #329 | Tragic 7.6% |
| Paiute | 0.0 /100 | #330 | Tragic 7.7% |
| Cajuns | 0.0 /100 | #331 | Tragic 7.8% |
| Menominee | 0.0 /100 | #332 | Tragic 7.8% |
| Cherokee | 0.0 /100 | #333 | Tragic 7.9% |
| Yuman | 0.0 /100 | #334 | Tragic 7.9% |
| Chickasaw | 0.0 /100 | #335 | Tragic 8.0% |
| Seminole | 0.0 /100 | #336 | Tragic 8.0% |
| Dutch West Indians | 0.0 /100 | #337 | Tragic 8.2% |
| Colville | 0.0 /100 | #338 | Tragic 8.2% |
| Pima | 0.0 /100 | #339 | Tragic 8.2% |
| Choctaw | 0.0 /100 | #340 | Tragic 8.3% |
| Creek | 0.0 /100 | #341 | Tragic 8.5% |
| Kiowa | 0.0 /100 | #342 | Tragic 8.6% |
Demographics Similar to Bahamians by Ambulatory Disability
In terms of ambulatory disability, the demographic groups most similar to Bahamians are Nepalese (6.6%, a difference of 0.060%), Guyanese (6.6%, a difference of 0.12%), Trinidadian and Tobagonian (6.6%, a difference of 0.25%), Spanish (6.6%, a difference of 0.26%), and Hmong (6.6%, a difference of 0.46%).
| Demographics | Rating | Rank | Ambulatory Disability |
| Spanish American Indians | 0.5 /100 | #258 | Tragic 6.5% |
| Aleuts | 0.4 /100 | #259 | Tragic 6.6% |
| Immigrants | Belize | 0.4 /100 | #260 | Tragic 6.6% |
| Irish | 0.4 /100 | #261 | Tragic 6.6% |
| English | 0.4 /100 | #262 | Tragic 6.6% |
| Hmong | 0.3 /100 | #263 | Tragic 6.6% |
| Nepalese | 0.2 /100 | #264 | Tragic 6.6% |
| Bahamians | 0.2 /100 | #265 | Tragic 6.6% |
| Guyanese | 0.2 /100 | #266 | Tragic 6.6% |
| Trinidadians and Tobagonians | 0.2 /100 | #267 | Tragic 6.6% |
| Spanish | 0.2 /100 | #268 | Tragic 6.6% |
| French | 0.1 /100 | #269 | Tragic 6.6% |
| Slovaks | 0.1 /100 | #270 | Tragic 6.7% |
| Immigrants | Trinidad and Tobago | 0.1 /100 | #271 | Tragic 6.7% |
| French Canadians | 0.1 /100 | #272 | Tragic 6.7% |