Cheyenne vs Vietnamese Female Disability
COMPARE
Cheyenne
Vietnamese
Female Disability
Female Disability Comparison
Cheyenne
Vietnamese
13.0%
FEMALE DISABILITY
0.1/ 100
METRIC RATING
275th/ 347
METRIC RANK
11.6%
FEMALE DISABILITY
99.5/ 100
METRIC RATING
89th/ 347
METRIC RANK
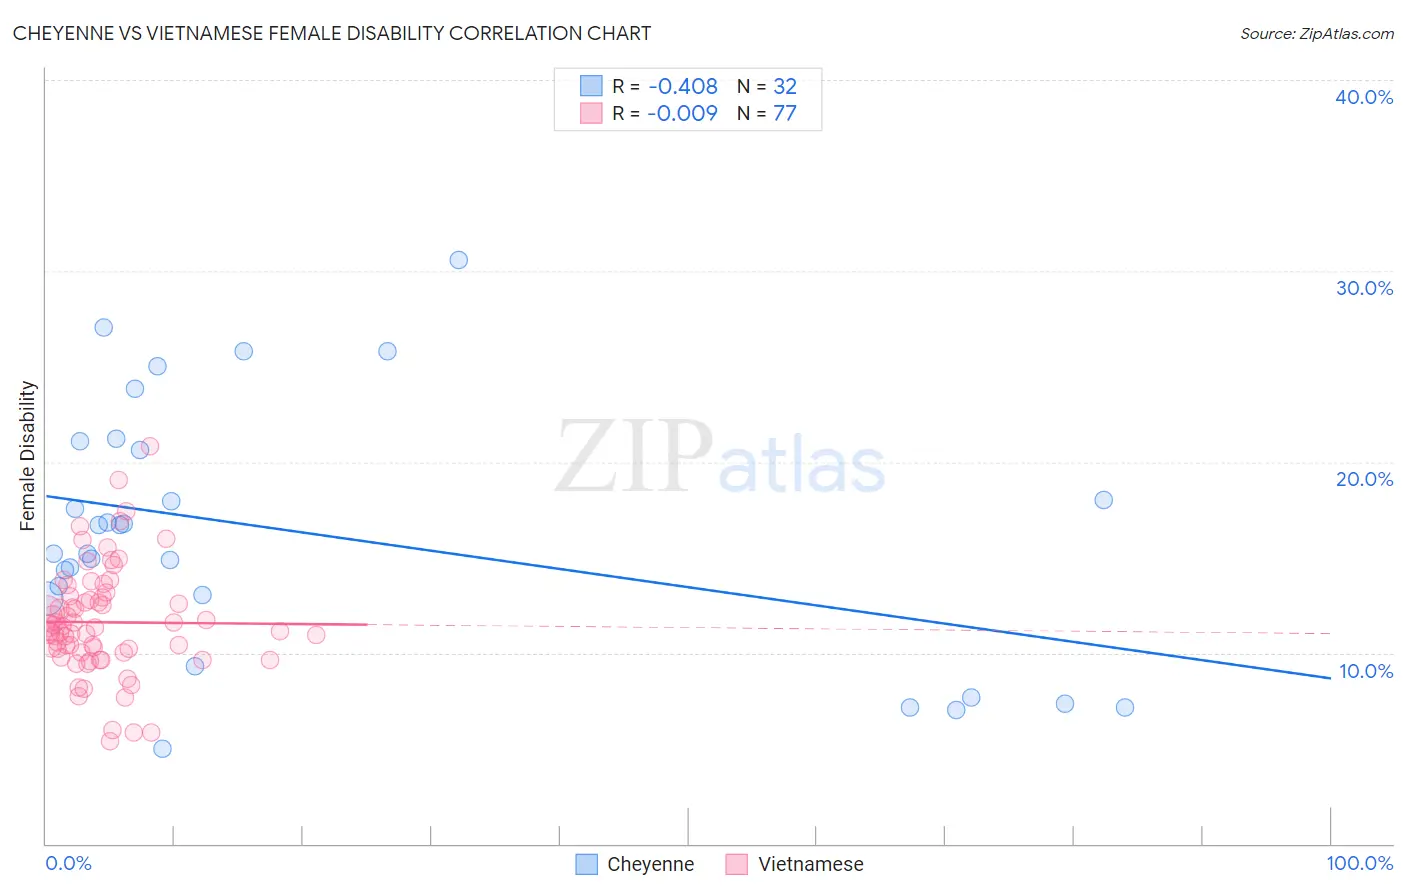
Cheyenne vs Vietnamese Female Disability Correlation Chart
The statistical analysis conducted on geographies consisting of 80,710,076 people shows a moderate negative correlation between the proportion of Cheyenne and percentage of females with a disability in the United States with a correlation coefficient (R) of -0.408 and weighted average of 13.0%. Similarly, the statistical analysis conducted on geographies consisting of 170,755,958 people shows no correlation between the proportion of Vietnamese and percentage of females with a disability in the United States with a correlation coefficient (R) of -0.009 and weighted average of 11.6%, a difference of 11.9%.
Female Disability Correlation Summary
| Measurement | Cheyenne | Vietnamese |
| Minimum | 5.0% | 5.4% |
| Maximum | 30.6% | 20.8% |
| Range | 25.6% | 15.5% |
| Mean | 16.3% | 11.6% |
| Median | 16.0% | 11.3% |
| Interquartile 25% (IQ1) | 12.9% | 10.0% |
| Interquartile 75% (IQ3) | 20.9% | 12.9% |
| Interquartile Range (IQR) | 7.9% | 2.9% |
| Standard Deviation (Sample) | 6.6% | 2.9% |
| Standard Deviation (Population) | 6.5% | 2.8% |
Similar Demographics by Female Disability
Demographics Similar to Cheyenne by Female Disability
In terms of female disability, the demographic groups most similar to Cheyenne are Portuguese (13.0%, a difference of 0.050%), Immigrants from Dominica (13.0%, a difference of 0.050%), Sioux (12.9%, a difference of 0.17%), German (12.9%, a difference of 0.19%), and Spanish (13.0%, a difference of 0.25%).
| Demographics | Rating | Rank | Female Disability |
| Immigrants | Laos | 0.4 /100 | #268 | Tragic 12.8% |
| Indonesians | 0.4 /100 | #269 | Tragic 12.8% |
| Immigrants | Liberia | 0.3 /100 | #270 | Tragic 12.9% |
| Dutch | 0.2 /100 | #271 | Tragic 12.9% |
| Germans | 0.1 /100 | #272 | Tragic 12.9% |
| Sioux | 0.1 /100 | #273 | Tragic 12.9% |
| Portuguese | 0.1 /100 | #274 | Tragic 13.0% |
| Cheyenne | 0.1 /100 | #275 | Tragic 13.0% |
| Immigrants | Dominica | 0.1 /100 | #276 | Tragic 13.0% |
| Spanish | 0.1 /100 | #277 | Tragic 13.0% |
| Scottish | 0.1 /100 | #278 | Tragic 13.0% |
| Arapaho | 0.1 /100 | #279 | Tragic 13.0% |
| Irish | 0.1 /100 | #280 | Tragic 13.1% |
| U.S. Virgin Islanders | 0.1 /100 | #281 | Tragic 13.1% |
| Welsh | 0.0 /100 | #282 | Tragic 13.1% |
Demographics Similar to Vietnamese by Female Disability
In terms of female disability, the demographic groups most similar to Vietnamese are Immigrants from Romania (11.6%, a difference of 0.010%), Immigrants from Zimbabwe (11.6%, a difference of 0.010%), Immigrants from Czechoslovakia (11.6%, a difference of 0.020%), Immigrants from Denmark (11.6%, a difference of 0.10%), and Yup'ik (11.6%, a difference of 0.10%).
| Demographics | Rating | Rank | Female Disability |
| Luxembourgers | 99.6 /100 | #82 | Exceptional 11.6% |
| Immigrants | Serbia | 99.6 /100 | #83 | Exceptional 11.6% |
| Immigrants | Poland | 99.6 /100 | #84 | Exceptional 11.6% |
| Palestinians | 99.6 /100 | #85 | Exceptional 11.6% |
| Immigrants | Cameroon | 99.6 /100 | #86 | Exceptional 11.6% |
| Immigrants | Denmark | 99.5 /100 | #87 | Exceptional 11.6% |
| Yup'ik | 99.5 /100 | #88 | Exceptional 11.6% |
| Vietnamese | 99.5 /100 | #89 | Exceptional 11.6% |
| Immigrants | Romania | 99.5 /100 | #90 | Exceptional 11.6% |
| Immigrants | Zimbabwe | 99.5 /100 | #91 | Exceptional 11.6% |
| Immigrants | Czechoslovakia | 99.5 /100 | #92 | Exceptional 11.6% |
| Immigrants | Sierra Leone | 99.4 /100 | #93 | Exceptional 11.6% |
| Immigrants | Brazil | 99.4 /100 | #94 | Exceptional 11.6% |
| Immigrants | Northern Europe | 99.4 /100 | #95 | Exceptional 11.6% |
| Immigrants | Russia | 99.0 /100 | #96 | Exceptional 11.7% |