Cheyenne vs Comanche Female Disability
COMPARE
Cheyenne
Comanche
Female Disability
Female Disability Comparison
Cheyenne
Comanche
13.0%
FEMALE DISABILITY
0.1/ 100
METRIC RATING
275th/ 347
METRIC RANK
14.2%
FEMALE DISABILITY
0.0/ 100
METRIC RATING
326th/ 347
METRIC RANK
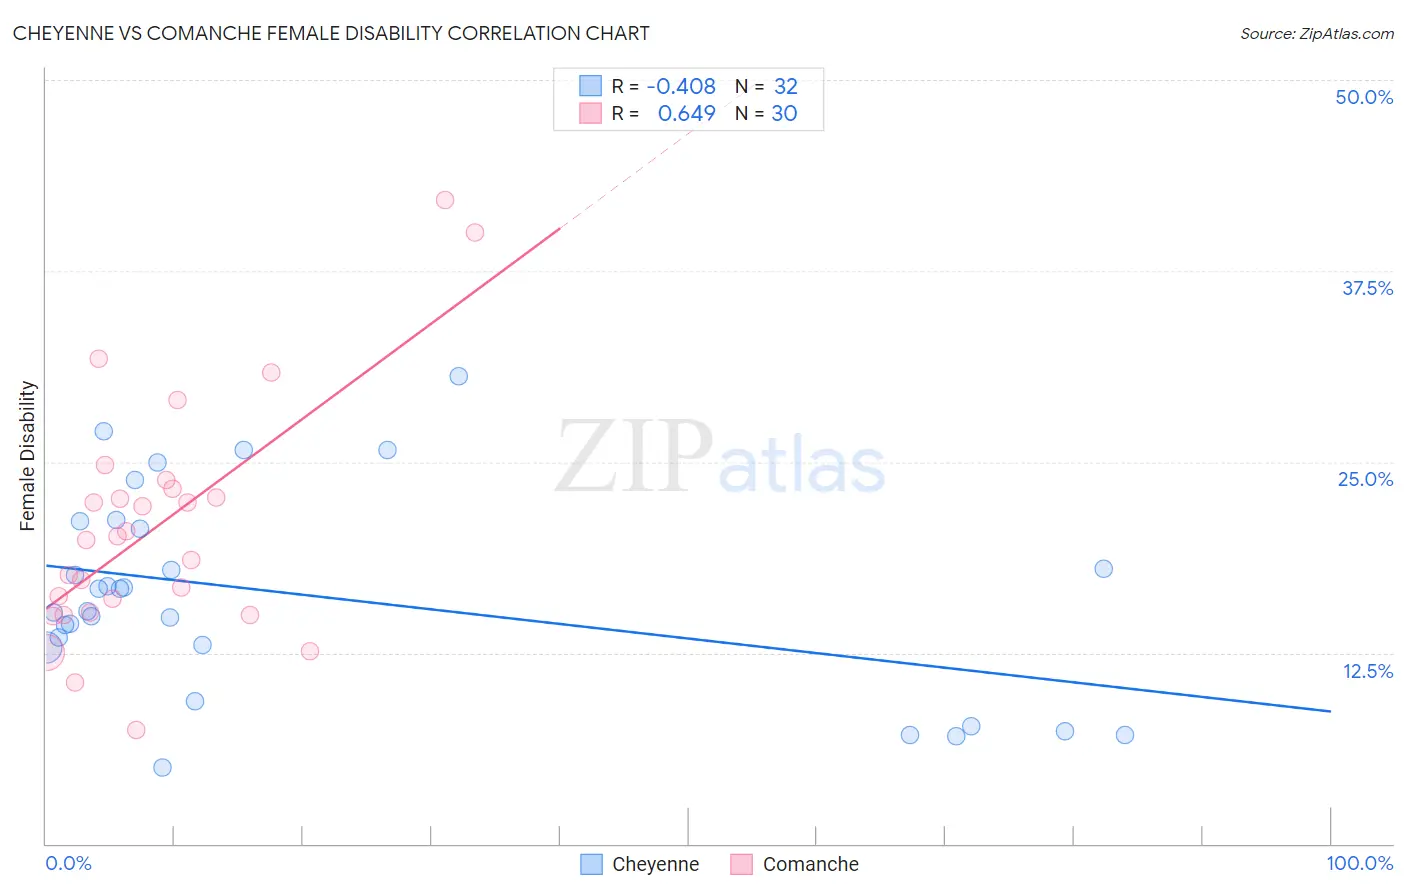
Cheyenne vs Comanche Female Disability Correlation Chart
The statistical analysis conducted on geographies consisting of 80,710,076 people shows a moderate negative correlation between the proportion of Cheyenne and percentage of females with a disability in the United States with a correlation coefficient (R) of -0.408 and weighted average of 13.0%. Similarly, the statistical analysis conducted on geographies consisting of 109,776,573 people shows a significant positive correlation between the proportion of Comanche and percentage of females with a disability in the United States with a correlation coefficient (R) of 0.649 and weighted average of 14.2%, a difference of 9.3%.
Female Disability Correlation Summary
| Measurement | Cheyenne | Comanche |
| Minimum | 5.0% | 7.4% |
| Maximum | 30.6% | 42.1% |
| Range | 25.6% | 34.7% |
| Mean | 16.3% | 20.8% |
| Median | 16.0% | 20.0% |
| Interquartile 25% (IQ1) | 12.9% | 15.1% |
| Interquartile 75% (IQ3) | 20.9% | 23.2% |
| Interquartile Range (IQR) | 7.9% | 8.1% |
| Standard Deviation (Sample) | 6.6% | 7.9% |
| Standard Deviation (Population) | 6.5% | 7.7% |
Similar Demographics by Female Disability
Demographics Similar to Cheyenne by Female Disability
In terms of female disability, the demographic groups most similar to Cheyenne are Portuguese (13.0%, a difference of 0.050%), Immigrants from Dominica (13.0%, a difference of 0.050%), Sioux (12.9%, a difference of 0.17%), German (12.9%, a difference of 0.19%), and Spanish (13.0%, a difference of 0.25%).
| Demographics | Rating | Rank | Female Disability |
| Immigrants | Laos | 0.4 /100 | #268 | Tragic 12.8% |
| Indonesians | 0.4 /100 | #269 | Tragic 12.8% |
| Immigrants | Liberia | 0.3 /100 | #270 | Tragic 12.9% |
| Dutch | 0.2 /100 | #271 | Tragic 12.9% |
| Germans | 0.1 /100 | #272 | Tragic 12.9% |
| Sioux | 0.1 /100 | #273 | Tragic 12.9% |
| Portuguese | 0.1 /100 | #274 | Tragic 13.0% |
| Cheyenne | 0.1 /100 | #275 | Tragic 13.0% |
| Immigrants | Dominica | 0.1 /100 | #276 | Tragic 13.0% |
| Spanish | 0.1 /100 | #277 | Tragic 13.0% |
| Scottish | 0.1 /100 | #278 | Tragic 13.0% |
| Arapaho | 0.1 /100 | #279 | Tragic 13.0% |
| Irish | 0.1 /100 | #280 | Tragic 13.1% |
| U.S. Virgin Islanders | 0.1 /100 | #281 | Tragic 13.1% |
| Welsh | 0.0 /100 | #282 | Tragic 13.1% |
Demographics Similar to Comanche by Female Disability
In terms of female disability, the demographic groups most similar to Comanche are Navajo (14.2%, a difference of 0.11%), Native/Alaskan (14.1%, a difference of 0.25%), Black/African American (14.1%, a difference of 0.27%), Pueblo (14.1%, a difference of 0.43%), and Potawatomi (14.1%, a difference of 0.44%).
| Demographics | Rating | Rank | Female Disability |
| Iroquois | 0.0 /100 | #319 | Tragic 14.0% |
| Americans | 0.0 /100 | #320 | Tragic 14.1% |
| Potawatomi | 0.0 /100 | #321 | Tragic 14.1% |
| Pueblo | 0.0 /100 | #322 | Tragic 14.1% |
| Blacks/African Americans | 0.0 /100 | #323 | Tragic 14.1% |
| Natives/Alaskans | 0.0 /100 | #324 | Tragic 14.1% |
| Navajo | 0.0 /100 | #325 | Tragic 14.2% |
| Comanche | 0.0 /100 | #326 | Tragic 14.2% |
| Ottawa | 0.0 /100 | #327 | Tragic 14.2% |
| Cape Verdeans | 0.0 /100 | #328 | Tragic 14.2% |
| Osage | 0.0 /100 | #329 | Tragic 14.3% |
| Yuman | 0.0 /100 | #330 | Tragic 14.5% |
| Immigrants | Cabo Verde | 0.0 /100 | #331 | Tragic 14.6% |
| Pima | 0.0 /100 | #332 | Tragic 14.8% |
| Immigrants | Azores | 0.0 /100 | #333 | Tragic 14.9% |