Cheyenne vs Kenyan Female Disability
COMPARE
Cheyenne
Kenyan
Female Disability
Female Disability Comparison
Cheyenne
Kenyans
13.0%
FEMALE DISABILITY
0.1/ 100
METRIC RATING
275th/ 347
METRIC RANK
11.9%
FEMALE DISABILITY
94.5/ 100
METRIC RATING
133rd/ 347
METRIC RANK
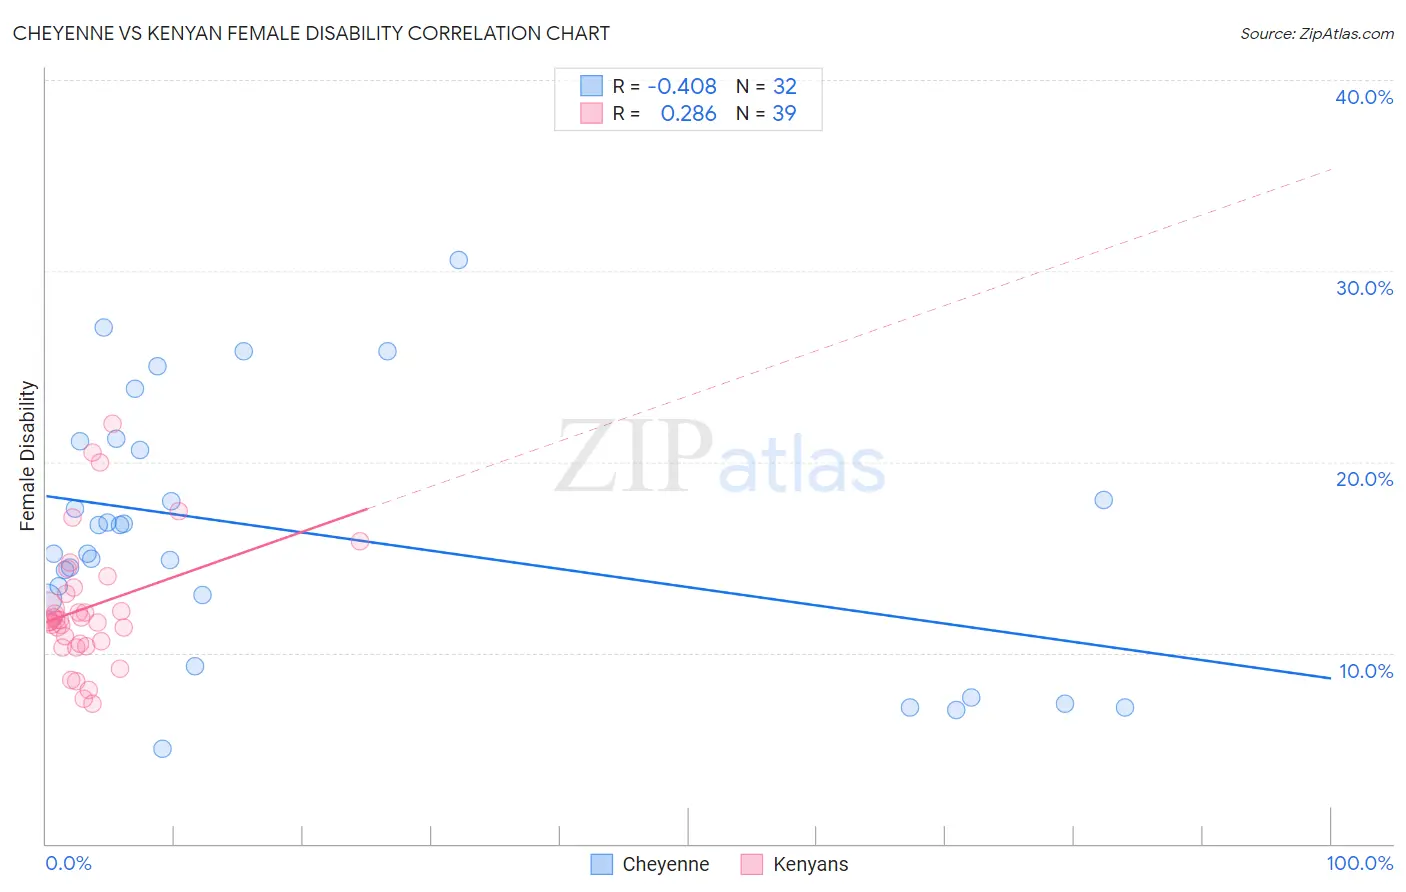
Cheyenne vs Kenyan Female Disability Correlation Chart
The statistical analysis conducted on geographies consisting of 80,710,076 people shows a moderate negative correlation between the proportion of Cheyenne and percentage of females with a disability in the United States with a correlation coefficient (R) of -0.408 and weighted average of 13.0%. Similarly, the statistical analysis conducted on geographies consisting of 168,210,759 people shows a weak positive correlation between the proportion of Kenyans and percentage of females with a disability in the United States with a correlation coefficient (R) of 0.286 and weighted average of 11.9%, a difference of 9.3%.
Female Disability Correlation Summary
| Measurement | Cheyenne | Kenyan |
| Minimum | 5.0% | 7.3% |
| Maximum | 30.6% | 22.0% |
| Range | 25.6% | 14.6% |
| Mean | 16.3% | 12.4% |
| Median | 16.0% | 11.7% |
| Interquartile 25% (IQ1) | 12.9% | 10.5% |
| Interquartile 75% (IQ3) | 20.9% | 13.4% |
| Interquartile Range (IQR) | 7.9% | 2.9% |
| Standard Deviation (Sample) | 6.6% | 3.3% |
| Standard Deviation (Population) | 6.5% | 3.3% |
Similar Demographics by Female Disability
Demographics Similar to Cheyenne by Female Disability
In terms of female disability, the demographic groups most similar to Cheyenne are Portuguese (13.0%, a difference of 0.050%), Immigrants from Dominica (13.0%, a difference of 0.050%), Sioux (12.9%, a difference of 0.17%), German (12.9%, a difference of 0.19%), and Spanish (13.0%, a difference of 0.25%).
| Demographics | Rating | Rank | Female Disability |
| Immigrants | Laos | 0.4 /100 | #268 | Tragic 12.8% |
| Indonesians | 0.4 /100 | #269 | Tragic 12.8% |
| Immigrants | Liberia | 0.3 /100 | #270 | Tragic 12.9% |
| Dutch | 0.2 /100 | #271 | Tragic 12.9% |
| Germans | 0.1 /100 | #272 | Tragic 12.9% |
| Sioux | 0.1 /100 | #273 | Tragic 12.9% |
| Portuguese | 0.1 /100 | #274 | Tragic 13.0% |
| Cheyenne | 0.1 /100 | #275 | Tragic 13.0% |
| Immigrants | Dominica | 0.1 /100 | #276 | Tragic 13.0% |
| Spanish | 0.1 /100 | #277 | Tragic 13.0% |
| Scottish | 0.1 /100 | #278 | Tragic 13.0% |
| Arapaho | 0.1 /100 | #279 | Tragic 13.0% |
| Irish | 0.1 /100 | #280 | Tragic 13.1% |
| U.S. Virgin Islanders | 0.1 /100 | #281 | Tragic 13.1% |
| Welsh | 0.0 /100 | #282 | Tragic 13.1% |
Demographics Similar to Kenyans by Female Disability
In terms of female disability, the demographic groups most similar to Kenyans are Immigrants from Nicaragua (11.9%, a difference of 0.0%), Immigrants from Syria (11.9%, a difference of 0.010%), Central American (11.9%, a difference of 0.070%), Ugandan (11.9%, a difference of 0.090%), and Arab (11.9%, a difference of 0.11%).
| Demographics | Rating | Rank | Female Disability |
| Immigrants | Europe | 96.2 /100 | #126 | Exceptional 11.8% |
| South American Indians | 95.8 /100 | #127 | Exceptional 11.8% |
| Immigrants | Latvia | 95.6 /100 | #128 | Exceptional 11.8% |
| Macedonians | 95.5 /100 | #129 | Exceptional 11.8% |
| Nicaraguans | 95.2 /100 | #130 | Exceptional 11.9% |
| Arabs | 95.1 /100 | #131 | Exceptional 11.9% |
| Immigrants | Syria | 94.6 /100 | #132 | Exceptional 11.9% |
| Kenyans | 94.5 /100 | #133 | Exceptional 11.9% |
| Immigrants | Nicaragua | 94.5 /100 | #134 | Exceptional 11.9% |
| Central Americans | 94.2 /100 | #135 | Exceptional 11.9% |
| Ugandans | 94.0 /100 | #136 | Exceptional 11.9% |
| Immigrants | Norway | 93.8 /100 | #137 | Exceptional 11.9% |
| Ecuadorians | 93.4 /100 | #138 | Exceptional 11.9% |
| Immigrants | Hungary | 92.8 /100 | #139 | Exceptional 11.9% |
| Romanians | 91.6 /100 | #140 | Exceptional 11.9% |