Immigrants from Vietnam vs Comanche Female Disability
COMPARE
Immigrants from Vietnam
Comanche
Female Disability
Female Disability Comparison
Immigrants from Vietnam
Comanche
11.5%
FEMALE DISABILITY
99.8/ 100
METRIC RATING
67th/ 347
METRIC RANK
14.2%
FEMALE DISABILITY
0.0/ 100
METRIC RATING
326th/ 347
METRIC RANK
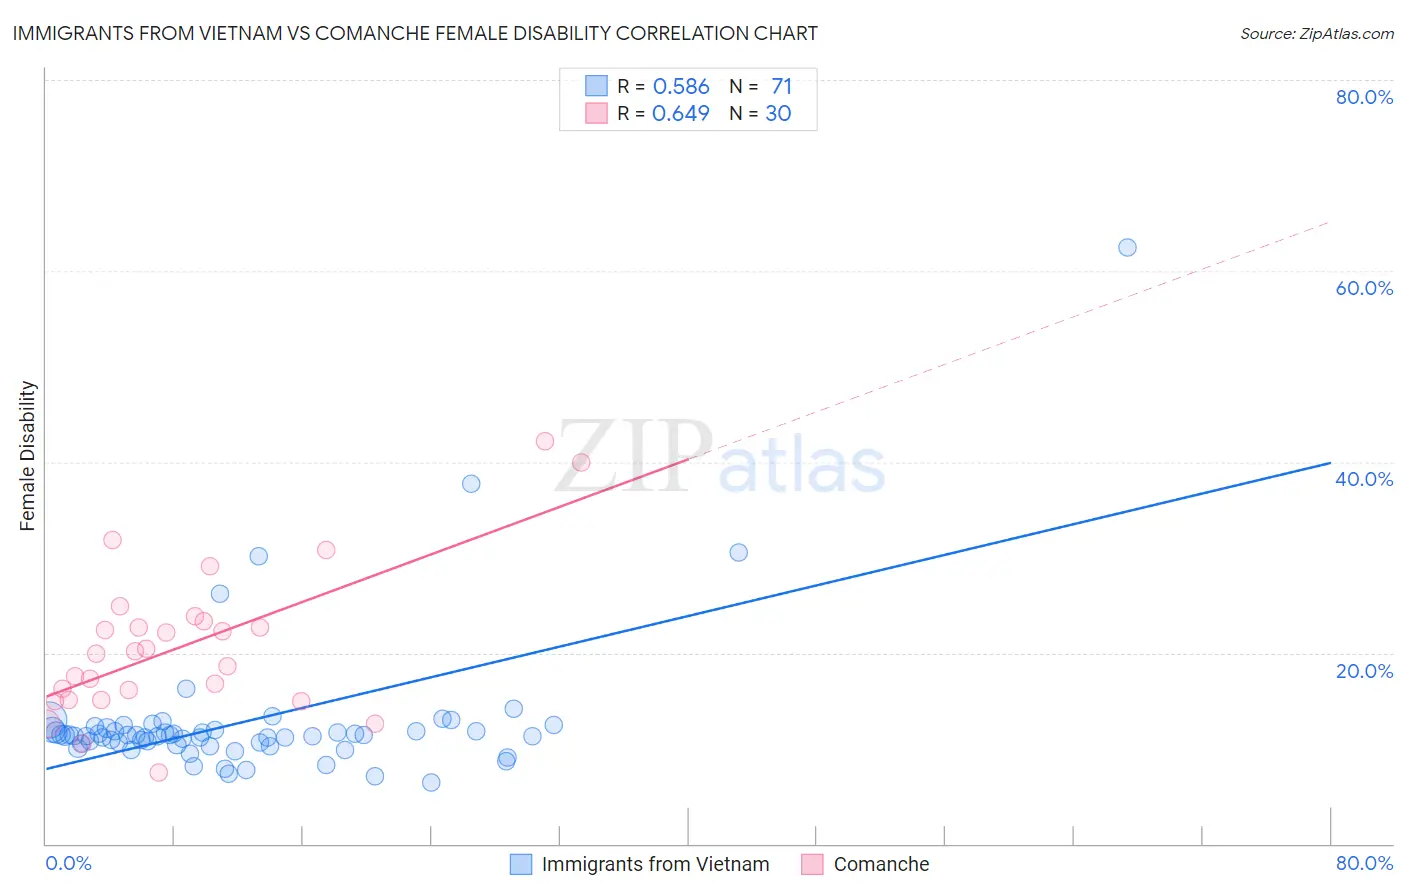
Immigrants from Vietnam vs Comanche Female Disability Correlation Chart
The statistical analysis conducted on geographies consisting of 404,760,443 people shows a substantial positive correlation between the proportion of Immigrants from Vietnam and percentage of females with a disability in the United States with a correlation coefficient (R) of 0.586 and weighted average of 11.5%. Similarly, the statistical analysis conducted on geographies consisting of 109,776,573 people shows a significant positive correlation between the proportion of Comanche and percentage of females with a disability in the United States with a correlation coefficient (R) of 0.649 and weighted average of 14.2%, a difference of 23.7%.
Female Disability Correlation Summary
| Measurement | Immigrants from Vietnam | Comanche |
| Minimum | 6.4% | 7.4% |
| Maximum | 62.5% | 42.1% |
| Range | 56.1% | 34.7% |
| Mean | 12.9% | 20.8% |
| Median | 11.3% | 20.0% |
| Interquartile 25% (IQ1) | 10.5% | 15.1% |
| Interquartile 75% (IQ3) | 12.0% | 23.2% |
| Interquartile Range (IQR) | 1.4% | 8.1% |
| Standard Deviation (Sample) | 7.8% | 7.9% |
| Standard Deviation (Population) | 7.8% | 7.7% |
Similar Demographics by Female Disability
Demographics Similar to Immigrants from Vietnam by Female Disability
In terms of female disability, the demographic groups most similar to Immigrants from Vietnam are Immigrants from Northern Africa (11.5%, a difference of 0.020%), Salvadoran (11.5%, a difference of 0.050%), Colombian (11.5%, a difference of 0.090%), Immigrants from Chile (11.5%, a difference of 0.10%), and Immigrants from Ireland (11.5%, a difference of 0.14%).
| Demographics | Rating | Rank | Female Disability |
| Immigrants | Bulgaria | 99.9 /100 | #60 | Exceptional 11.4% |
| Immigrants | France | 99.9 /100 | #61 | Exceptional 11.4% |
| Sri Lankans | 99.9 /100 | #62 | Exceptional 11.4% |
| Immigrants | Colombia | 99.9 /100 | #63 | Exceptional 11.4% |
| Immigrants | El Salvador | 99.9 /100 | #64 | Exceptional 11.4% |
| Immigrants | South America | 99.9 /100 | #65 | Exceptional 11.4% |
| Salvadorans | 99.8 /100 | #66 | Exceptional 11.5% |
| Immigrants | Vietnam | 99.8 /100 | #67 | Exceptional 11.5% |
| Immigrants | Northern Africa | 99.8 /100 | #68 | Exceptional 11.5% |
| Colombians | 99.8 /100 | #69 | Exceptional 11.5% |
| Immigrants | Chile | 99.8 /100 | #70 | Exceptional 11.5% |
| Immigrants | Ireland | 99.8 /100 | #71 | Exceptional 11.5% |
| Chileans | 99.8 /100 | #72 | Exceptional 11.5% |
| Immigrants | Switzerland | 99.8 /100 | #73 | Exceptional 11.5% |
| Bhutanese | 99.8 /100 | #74 | Exceptional 11.5% |
Demographics Similar to Comanche by Female Disability
In terms of female disability, the demographic groups most similar to Comanche are Navajo (14.2%, a difference of 0.11%), Native/Alaskan (14.1%, a difference of 0.25%), Black/African American (14.1%, a difference of 0.27%), Pueblo (14.1%, a difference of 0.43%), and Potawatomi (14.1%, a difference of 0.44%).
| Demographics | Rating | Rank | Female Disability |
| Iroquois | 0.0 /100 | #319 | Tragic 14.0% |
| Americans | 0.0 /100 | #320 | Tragic 14.1% |
| Potawatomi | 0.0 /100 | #321 | Tragic 14.1% |
| Pueblo | 0.0 /100 | #322 | Tragic 14.1% |
| Blacks/African Americans | 0.0 /100 | #323 | Tragic 14.1% |
| Natives/Alaskans | 0.0 /100 | #324 | Tragic 14.1% |
| Navajo | 0.0 /100 | #325 | Tragic 14.2% |
| Comanche | 0.0 /100 | #326 | Tragic 14.2% |
| Ottawa | 0.0 /100 | #327 | Tragic 14.2% |
| Cape Verdeans | 0.0 /100 | #328 | Tragic 14.2% |
| Osage | 0.0 /100 | #329 | Tragic 14.3% |
| Yuman | 0.0 /100 | #330 | Tragic 14.5% |
| Immigrants | Cabo Verde | 0.0 /100 | #331 | Tragic 14.6% |
| Pima | 0.0 /100 | #332 | Tragic 14.8% |
| Immigrants | Azores | 0.0 /100 | #333 | Tragic 14.9% |