Central American vs Spaniard In Labor Force | Age 20-24
COMPARE
Central American
Spaniard
In Labor Force | Age 20-24
In Labor Force | Age 20-24 Comparison
Central Americans
Spaniards
75.0%
IN LABOR FORCE | AGE 20-24
48.7/ 100
METRIC RATING
176th/ 347
METRIC RANK
75.5%
IN LABOR FORCE | AGE 20-24
82.0/ 100
METRIC RATING
143rd/ 347
METRIC RANK
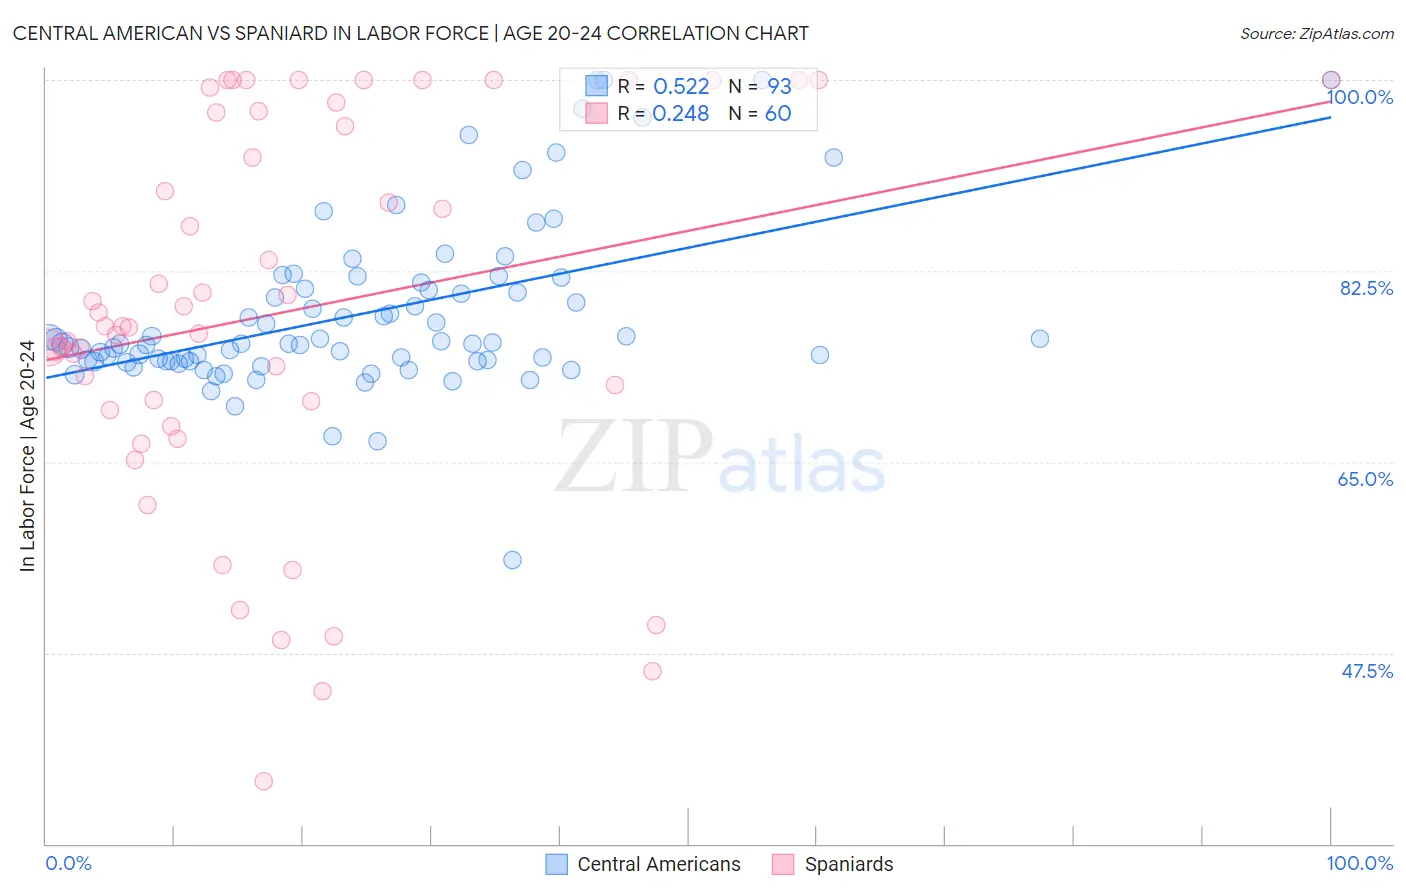
Central American vs Spaniard In Labor Force | Age 20-24 Correlation Chart
The statistical analysis conducted on geographies consisting of 504,332,893 people shows a substantial positive correlation between the proportion of Central Americans and labor force participation rate among population between the ages 20 and 24 in the United States with a correlation coefficient (R) of 0.522 and weighted average of 75.0%. Similarly, the statistical analysis conducted on geographies consisting of 443,259,827 people shows a weak positive correlation between the proportion of Spaniards and labor force participation rate among population between the ages 20 and 24 in the United States with a correlation coefficient (R) of 0.248 and weighted average of 75.5%, a difference of 0.57%.
In Labor Force | Age 20-24 Correlation Summary
| Measurement | Central American | Spaniard |
| Minimum | 56.0% | 35.7% |
| Maximum | 100.0% | 100.0% |
| Range | 44.0% | 64.3% |
| Mean | 78.6% | 78.8% |
| Median | 75.8% | 77.4% |
| Interquartile 25% (IQ1) | 74.2% | 70.2% |
| Interquartile 75% (IQ3) | 81.1% | 97.1% |
| Interquartile Range (IQR) | 6.9% | 26.9% |
| Standard Deviation (Sample) | 7.8% | 17.3% |
| Standard Deviation (Population) | 7.8% | 17.2% |
Similar Demographics by In Labor Force | Age 20-24
Demographics Similar to Central Americans by In Labor Force | Age 20-24
In terms of in labor force | age 20-24, the demographic groups most similar to Central Americans are Syrian (75.0%, a difference of 0.010%), Immigrants from Mexico (75.0%, a difference of 0.010%), Immigrants from Croatia (75.1%, a difference of 0.020%), South African (75.0%, a difference of 0.020%), and Yakama (75.1%, a difference of 0.030%).
| Demographics | Rating | Rank | In Labor Force | Age 20-24 |
| Immigrants | Philippines | 55.8 /100 | #169 | Average 75.1% |
| Mexicans | 52.1 /100 | #170 | Average 75.1% |
| Cajuns | 51.1 /100 | #171 | Average 75.1% |
| Yakama | 50.8 /100 | #172 | Average 75.1% |
| Immigrants | Croatia | 50.2 /100 | #173 | Average 75.1% |
| South Africans | 50.0 /100 | #174 | Average 75.0% |
| Syrians | 49.5 /100 | #175 | Average 75.0% |
| Central Americans | 48.7 /100 | #176 | Average 75.0% |
| Immigrants | Mexico | 47.8 /100 | #177 | Average 75.0% |
| Immigrants | Central America | 45.0 /100 | #178 | Average 75.0% |
| Immigrants | Latvia | 44.1 /100 | #179 | Average 75.0% |
| Immigrants | Czechoslovakia | 44.0 /100 | #180 | Average 75.0% |
| Africans | 42.5 /100 | #181 | Average 75.0% |
| Immigrants | South Africa | 36.9 /100 | #182 | Fair 74.9% |
| Immigrants | Costa Rica | 36.7 /100 | #183 | Fair 74.9% |
Demographics Similar to Spaniards by In Labor Force | Age 20-24
In terms of in labor force | age 20-24, the demographic groups most similar to Spaniards are Bhutanese (75.4%, a difference of 0.030%), Blackfeet (75.5%, a difference of 0.040%), Romanian (75.5%, a difference of 0.050%), Korean (75.4%, a difference of 0.050%), and Immigrants from Brazil (75.5%, a difference of 0.070%).
| Demographics | Rating | Rank | In Labor Force | Age 20-24 |
| Immigrants | Brazil | 84.8 /100 | #136 | Excellent 75.5% |
| Jordanians | 84.8 /100 | #137 | Excellent 75.5% |
| Australians | 84.8 /100 | #138 | Excellent 75.5% |
| Immigrants | England | 84.6 /100 | #139 | Excellent 75.5% |
| Delaware | 84.5 /100 | #140 | Excellent 75.5% |
| Romanians | 84.1 /100 | #141 | Excellent 75.5% |
| Blackfeet | 83.6 /100 | #142 | Excellent 75.5% |
| Spaniards | 82.0 /100 | #143 | Excellent 75.5% |
| Bhutanese | 80.8 /100 | #144 | Excellent 75.4% |
| Koreans | 79.7 /100 | #145 | Good 75.4% |
| Mexican American Indians | 78.8 /100 | #146 | Good 75.4% |
| Comanche | 77.6 /100 | #147 | Good 75.4% |
| Immigrants | Cambodia | 76.7 /100 | #148 | Good 75.4% |
| Ugandans | 76.1 /100 | #149 | Good 75.4% |
| Salvadorans | 74.8 /100 | #150 | Good 75.3% |