Central American vs Spaniard 5th Grade
COMPARE
Central American
Spaniard
5th Grade
5th Grade Comparison
Central Americans
Spaniards
95.1%
5TH GRADE
0.0/ 100
METRIC RATING
337th/ 347
METRIC RANK
97.5%
5TH GRADE
81.9/ 100
METRIC RATING
146th/ 347
METRIC RANK
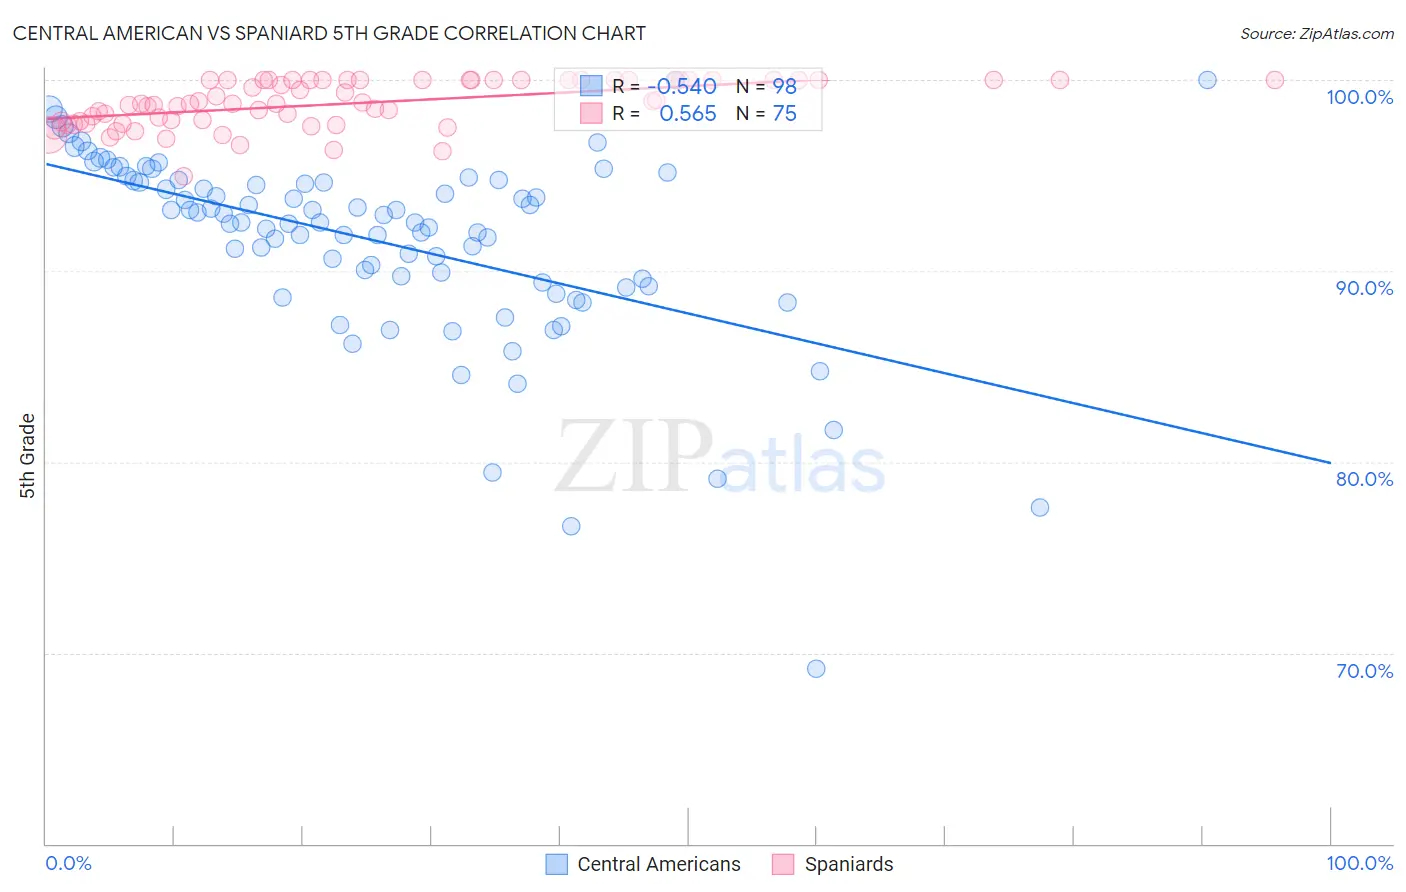
Central American vs Spaniard 5th Grade Correlation Chart
The statistical analysis conducted on geographies consisting of 504,619,198 people shows a substantial negative correlation between the proportion of Central Americans and percentage of population with at least 5th grade education in the United States with a correlation coefficient (R) of -0.540 and weighted average of 95.1%. Similarly, the statistical analysis conducted on geographies consisting of 443,544,503 people shows a substantial positive correlation between the proportion of Spaniards and percentage of population with at least 5th grade education in the United States with a correlation coefficient (R) of 0.565 and weighted average of 97.5%, a difference of 2.5%.
5th Grade Correlation Summary
| Measurement | Central American | Spaniard |
| Minimum | 69.2% | 94.9% |
| Maximum | 100.0% | 100.0% |
| Range | 30.8% | 5.1% |
| Mean | 91.5% | 98.8% |
| Median | 92.6% | 98.8% |
| Interquartile 25% (IQ1) | 89.4% | 97.8% |
| Interquartile 75% (IQ3) | 94.7% | 100.0% |
| Interquartile Range (IQR) | 5.3% | 2.2% |
| Standard Deviation (Sample) | 5.0% | 1.2% |
| Standard Deviation (Population) | 5.0% | 1.2% |
Similar Demographics by 5th Grade
Demographics Similar to Central Americans by 5th Grade
In terms of 5th grade, the demographic groups most similar to Central Americans are Immigrants from the Azores (95.1%, a difference of 0.070%), Immigrants from Cabo Verde (94.9%, a difference of 0.16%), Mexican (95.2%, a difference of 0.17%), Nepalese (95.2%, a difference of 0.19%), and Immigrants from Yemen (94.9%, a difference of 0.21%).
| Demographics | Rating | Rank | 5th Grade |
| Immigrants | Armenia | 0.0 /100 | #330 | Tragic 95.4% |
| Immigrants | Honduras | 0.0 /100 | #331 | Tragic 95.4% |
| Immigrants | Dominican Republic | 0.0 /100 | #332 | Tragic 95.3% |
| Immigrants | Latin America | 0.0 /100 | #333 | Tragic 95.3% |
| Nepalese | 0.0 /100 | #334 | Tragic 95.2% |
| Mexicans | 0.0 /100 | #335 | Tragic 95.2% |
| Immigrants | Azores | 0.0 /100 | #336 | Tragic 95.1% |
| Central Americans | 0.0 /100 | #337 | Tragic 95.1% |
| Immigrants | Cabo Verde | 0.0 /100 | #338 | Tragic 94.9% |
| Immigrants | Yemen | 0.0 /100 | #339 | Tragic 94.9% |
| Guatemalans | 0.0 /100 | #340 | Tragic 94.8% |
| Yakama | 0.0 /100 | #341 | Tragic 94.8% |
| Immigrants | Central America | 0.0 /100 | #342 | Tragic 94.7% |
| Salvadorans | 0.0 /100 | #343 | Tragic 94.6% |
| Immigrants | Mexico | 0.0 /100 | #344 | Tragic 94.6% |
Demographics Similar to Spaniards by 5th Grade
In terms of 5th grade, the demographic groups most similar to Spaniards are Jordanian (97.5%, a difference of 0.0%), Immigrants from Greece (97.5%, a difference of 0.010%), Soviet Union (97.5%, a difference of 0.010%), Immigrants from Israel (97.5%, a difference of 0.020%), and Hopi (97.5%, a difference of 0.020%).
| Demographics | Rating | Rank | 5th Grade |
| Immigrants | Turkey | 86.7 /100 | #139 | Excellent 97.5% |
| Burmese | 86.1 /100 | #140 | Excellent 97.5% |
| Seminole | 85.8 /100 | #141 | Excellent 97.5% |
| Israelis | 85.5 /100 | #142 | Excellent 97.5% |
| Immigrants | North Macedonia | 85.4 /100 | #143 | Excellent 97.5% |
| Immigrants | Greece | 83.2 /100 | #144 | Excellent 97.5% |
| Jordanians | 82.6 /100 | #145 | Excellent 97.5% |
| Spaniards | 81.9 /100 | #146 | Excellent 97.5% |
| Soviet Union | 81.2 /100 | #147 | Excellent 97.5% |
| Immigrants | Israel | 79.1 /100 | #148 | Good 97.5% |
| Hopi | 78.6 /100 | #149 | Good 97.5% |
| Immigrants | South Central Asia | 78.6 /100 | #150 | Good 97.5% |
| Immigrants | Eastern Europe | 75.0 /100 | #151 | Good 97.4% |
| Ute | 74.9 /100 | #152 | Good 97.4% |
| Alsatians | 74.3 /100 | #153 | Good 97.4% |