Central American vs Immigrants from Syria Cognitive Disability
COMPARE
Central American
Immigrants from Syria
Cognitive Disability
Cognitive Disability Comparison
Central Americans
Immigrants from Syria
17.7%
COGNITIVE DISABILITY
4.5/ 100
METRIC RATING
222nd/ 347
METRIC RANK
17.2%
COGNITIVE DISABILITY
63.5/ 100
METRIC RATING
167th/ 347
METRIC RANK
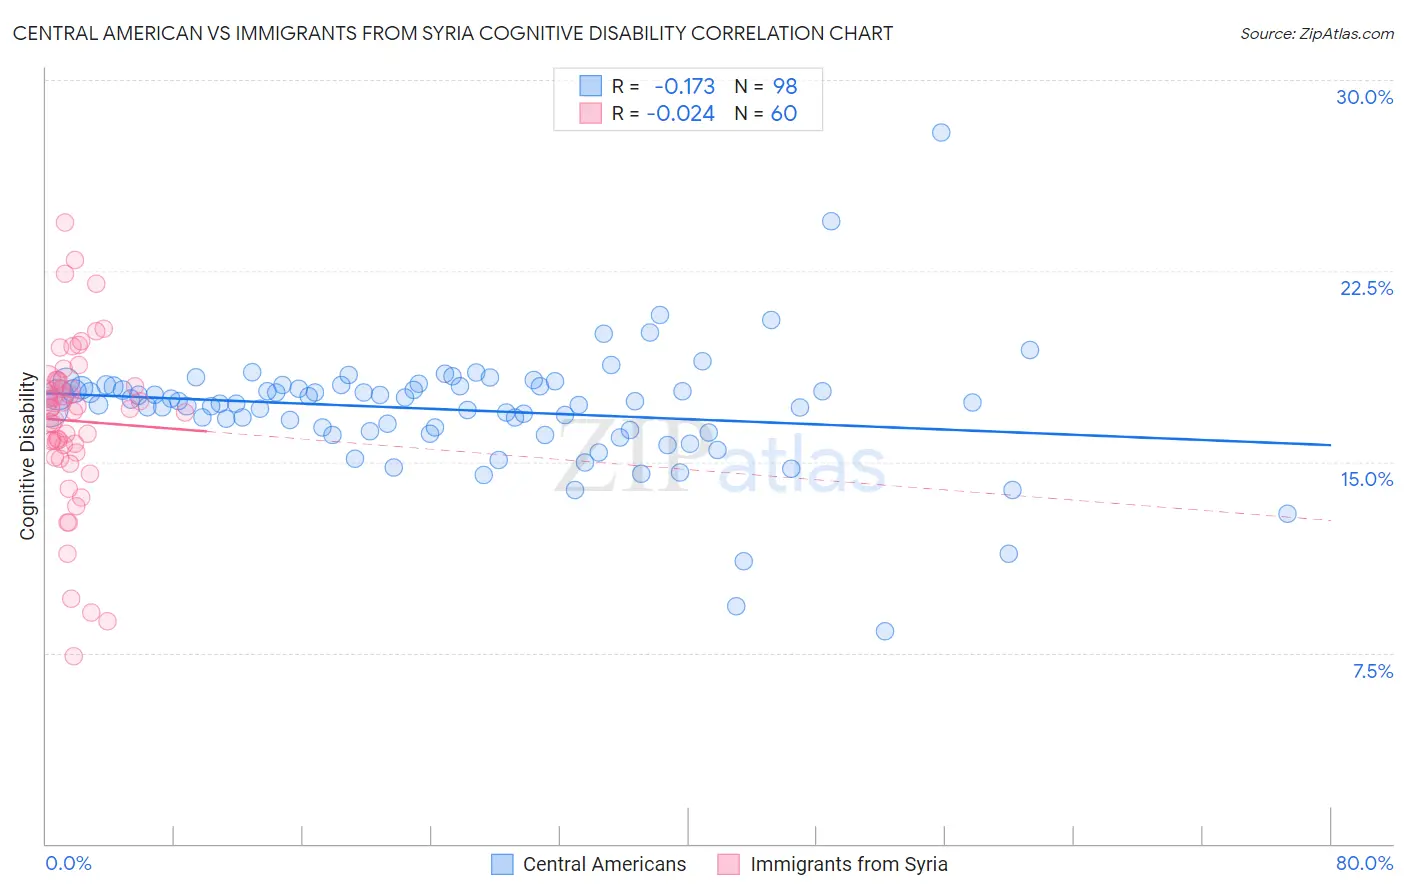
Central American vs Immigrants from Syria Cognitive Disability Correlation Chart
The statistical analysis conducted on geographies consisting of 504,492,457 people shows a poor negative correlation between the proportion of Central Americans and percentage of population with cognitive disability in the United States with a correlation coefficient (R) of -0.173 and weighted average of 17.7%. Similarly, the statistical analysis conducted on geographies consisting of 174,112,347 people shows no correlation between the proportion of Immigrants from Syria and percentage of population with cognitive disability in the United States with a correlation coefficient (R) of -0.024 and weighted average of 17.2%, a difference of 2.6%.
Cognitive Disability Correlation Summary
| Measurement | Central American | Immigrants from Syria |
| Minimum | 8.3% | 7.4% |
| Maximum | 27.9% | 24.4% |
| Range | 19.6% | 17.0% |
| Mean | 17.0% | 16.6% |
| Median | 17.3% | 17.1% |
| Interquartile 25% (IQ1) | 16.2% | 15.5% |
| Interquartile 75% (IQ3) | 18.0% | 18.2% |
| Interquartile Range (IQR) | 1.8% | 2.7% |
| Standard Deviation (Sample) | 2.4% | 3.2% |
| Standard Deviation (Population) | 2.4% | 3.2% |
Similar Demographics by Cognitive Disability
Demographics Similar to Central Americans by Cognitive Disability
In terms of cognitive disability, the demographic groups most similar to Central Americans are Alsatian (17.7%, a difference of 0.010%), Moroccan (17.6%, a difference of 0.20%), Fijian (17.7%, a difference of 0.20%), Vietnamese (17.7%, a difference of 0.21%), and Zimbabwean (17.6%, a difference of 0.22%).
| Demographics | Rating | Rank | Cognitive Disability |
| Alaskan Athabascans | 6.9 /100 | #215 | Tragic 17.6% |
| Okinawans | 6.8 /100 | #216 | Tragic 17.6% |
| Salvadorans | 6.7 /100 | #217 | Tragic 17.6% |
| Icelanders | 6.4 /100 | #218 | Tragic 17.6% |
| Immigrants | Sierra Leone | 6.3 /100 | #219 | Tragic 17.6% |
| Zimbabweans | 6.1 /100 | #220 | Tragic 17.6% |
| Moroccans | 5.9 /100 | #221 | Tragic 17.6% |
| Central Americans | 4.5 /100 | #222 | Tragic 17.7% |
| Alsatians | 4.5 /100 | #223 | Tragic 17.7% |
| Fijians | 3.4 /100 | #224 | Tragic 17.7% |
| Vietnamese | 3.4 /100 | #225 | Tragic 17.7% |
| Marshallese | 2.7 /100 | #226 | Tragic 17.7% |
| Immigrants | St. Vincent and the Grenadines | 2.6 /100 | #227 | Tragic 17.7% |
| Immigrants | Central America | 2.3 /100 | #228 | Tragic 17.7% |
| Immigrants | Guatemala | 2.2 /100 | #229 | Tragic 17.7% |
Demographics Similar to Immigrants from Syria by Cognitive Disability
In terms of cognitive disability, the demographic groups most similar to Immigrants from Syria are Immigrants from Ecuador (17.2%, a difference of 0.030%), Immigrants (17.2%, a difference of 0.030%), Immigrants from Albania (17.2%, a difference of 0.040%), Immigrants from Portugal (17.2%, a difference of 0.050%), and Ecuadorian (17.2%, a difference of 0.12%).
| Demographics | Rating | Rank | Cognitive Disability |
| Australians | 72.4 /100 | #160 | Good 17.2% |
| Americans | 72.2 /100 | #161 | Good 17.2% |
| Yugoslavians | 71.6 /100 | #162 | Good 17.2% |
| Immigrants | Switzerland | 71.5 /100 | #163 | Good 17.2% |
| Armenians | 70.1 /100 | #164 | Good 17.2% |
| Immigrants | Albania | 64.9 /100 | #165 | Good 17.2% |
| Immigrants | Ecuador | 64.4 /100 | #166 | Good 17.2% |
| Immigrants | Syria | 63.5 /100 | #167 | Good 17.2% |
| Immigrants | Immigrants | 62.5 /100 | #168 | Good 17.2% |
| Immigrants | Portugal | 61.8 /100 | #169 | Good 17.2% |
| Ecuadorians | 59.6 /100 | #170 | Average 17.2% |
| Tlingit-Haida | 59.4 /100 | #171 | Average 17.2% |
| Immigrants | Turkey | 56.7 /100 | #172 | Average 17.2% |
| Immigrants | Northern Africa | 50.2 /100 | #173 | Average 17.3% |
| Laotians | 50.0 /100 | #174 | Average 17.3% |