Central American vs Immigrants from Sweden Cognitive Disability
COMPARE
Central American
Immigrants from Sweden
Cognitive Disability
Cognitive Disability Comparison
Central Americans
Immigrants from Sweden
17.7%
COGNITIVE DISABILITY
4.5/ 100
METRIC RATING
222nd/ 347
METRIC RANK
16.7%
COGNITIVE DISABILITY
99.4/ 100
METRIC RATING
70th/ 347
METRIC RANK
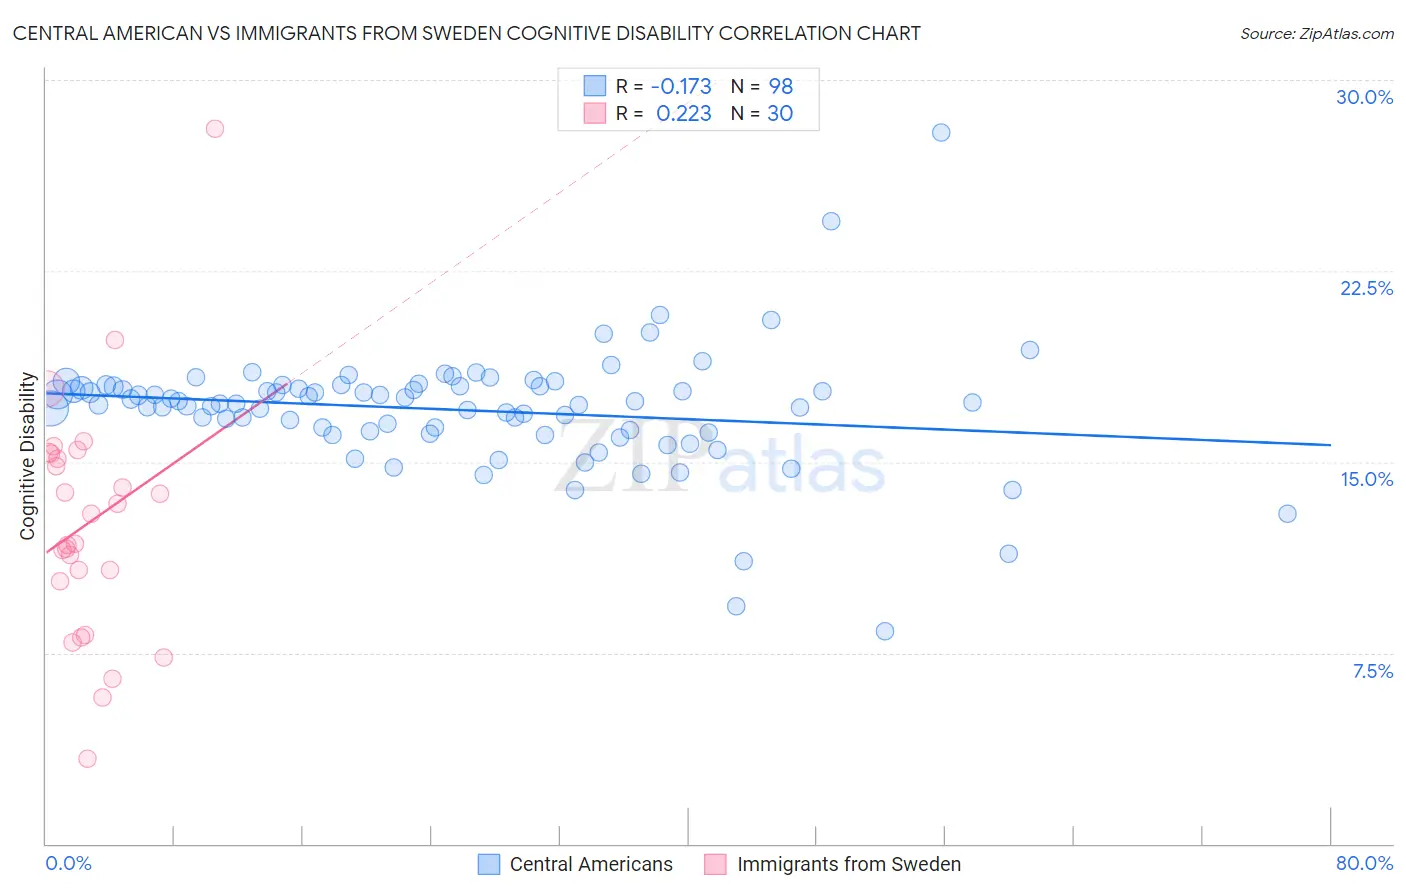
Central American vs Immigrants from Sweden Cognitive Disability Correlation Chart
The statistical analysis conducted on geographies consisting of 504,492,457 people shows a poor negative correlation between the proportion of Central Americans and percentage of population with cognitive disability in the United States with a correlation coefficient (R) of -0.173 and weighted average of 17.7%. Similarly, the statistical analysis conducted on geographies consisting of 164,746,937 people shows a weak positive correlation between the proportion of Immigrants from Sweden and percentage of population with cognitive disability in the United States with a correlation coefficient (R) of 0.223 and weighted average of 16.7%, a difference of 6.0%.
Cognitive Disability Correlation Summary
| Measurement | Central American | Immigrants from Sweden |
| Minimum | 8.3% | 3.4% |
| Maximum | 27.9% | 28.1% |
| Range | 19.6% | 24.7% |
| Mean | 17.0% | 12.6% |
| Median | 17.3% | 12.4% |
| Interquartile 25% (IQ1) | 16.2% | 10.3% |
| Interquartile 75% (IQ3) | 18.0% | 15.3% |
| Interquartile Range (IQR) | 1.8% | 5.0% |
| Standard Deviation (Sample) | 2.4% | 4.8% |
| Standard Deviation (Population) | 2.4% | 4.7% |
Similar Demographics by Cognitive Disability
Demographics Similar to Central Americans by Cognitive Disability
In terms of cognitive disability, the demographic groups most similar to Central Americans are Alsatian (17.7%, a difference of 0.010%), Moroccan (17.6%, a difference of 0.20%), Fijian (17.7%, a difference of 0.20%), Vietnamese (17.7%, a difference of 0.21%), and Zimbabwean (17.6%, a difference of 0.22%).
| Demographics | Rating | Rank | Cognitive Disability |
| Alaskan Athabascans | 6.9 /100 | #215 | Tragic 17.6% |
| Okinawans | 6.8 /100 | #216 | Tragic 17.6% |
| Salvadorans | 6.7 /100 | #217 | Tragic 17.6% |
| Icelanders | 6.4 /100 | #218 | Tragic 17.6% |
| Immigrants | Sierra Leone | 6.3 /100 | #219 | Tragic 17.6% |
| Zimbabweans | 6.1 /100 | #220 | Tragic 17.6% |
| Moroccans | 5.9 /100 | #221 | Tragic 17.6% |
| Central Americans | 4.5 /100 | #222 | Tragic 17.7% |
| Alsatians | 4.5 /100 | #223 | Tragic 17.7% |
| Fijians | 3.4 /100 | #224 | Tragic 17.7% |
| Vietnamese | 3.4 /100 | #225 | Tragic 17.7% |
| Marshallese | 2.7 /100 | #226 | Tragic 17.7% |
| Immigrants | St. Vincent and the Grenadines | 2.6 /100 | #227 | Tragic 17.7% |
| Immigrants | Central America | 2.3 /100 | #228 | Tragic 17.7% |
| Immigrants | Guatemala | 2.2 /100 | #229 | Tragic 17.7% |
Demographics Similar to Immigrants from Sweden by Cognitive Disability
In terms of cognitive disability, the demographic groups most similar to Immigrants from Sweden are Immigrants from Uzbekistan (16.7%, a difference of 0.010%), Immigrants from Belgium (16.7%, a difference of 0.010%), German (16.7%, a difference of 0.020%), Burmese (16.7%, a difference of 0.030%), and Slavic (16.7%, a difference of 0.030%).
| Demographics | Rating | Rank | Cognitive Disability |
| Argentineans | 99.6 /100 | #63 | Exceptional 16.6% |
| Venezuelans | 99.6 /100 | #64 | Exceptional 16.6% |
| Colombians | 99.6 /100 | #65 | Exceptional 16.6% |
| Immigrants | Ukraine | 99.5 /100 | #66 | Exceptional 16.6% |
| Latvians | 99.5 /100 | #67 | Exceptional 16.6% |
| Ukrainians | 99.4 /100 | #68 | Exceptional 16.6% |
| Immigrants | Uzbekistan | 99.4 /100 | #69 | Exceptional 16.7% |
| Immigrants | Sweden | 99.4 /100 | #70 | Exceptional 16.7% |
| Immigrants | Belgium | 99.3 /100 | #71 | Exceptional 16.7% |
| Germans | 99.3 /100 | #72 | Exceptional 16.7% |
| Burmese | 99.3 /100 | #73 | Exceptional 16.7% |
| Slavs | 99.3 /100 | #74 | Exceptional 16.7% |
| Estonians | 99.3 /100 | #75 | Exceptional 16.7% |
| Immigrants | Serbia | 99.3 /100 | #76 | Exceptional 16.7% |
| Immigrants | Hungary | 99.3 /100 | #77 | Exceptional 16.7% |