Central American vs Immigrants from India Median Family Income
COMPARE
Central American
Immigrants from India
Median Family Income
Median Family Income Comparison
Central Americans
Immigrants from India
$91,087
MEDIAN FAMILY INCOME
0.3/ 100
METRIC RATING
266th/ 347
METRIC RANK
$134,028
MEDIAN FAMILY INCOME
100.0/ 100
METRIC RATING
4th/ 347
METRIC RANK
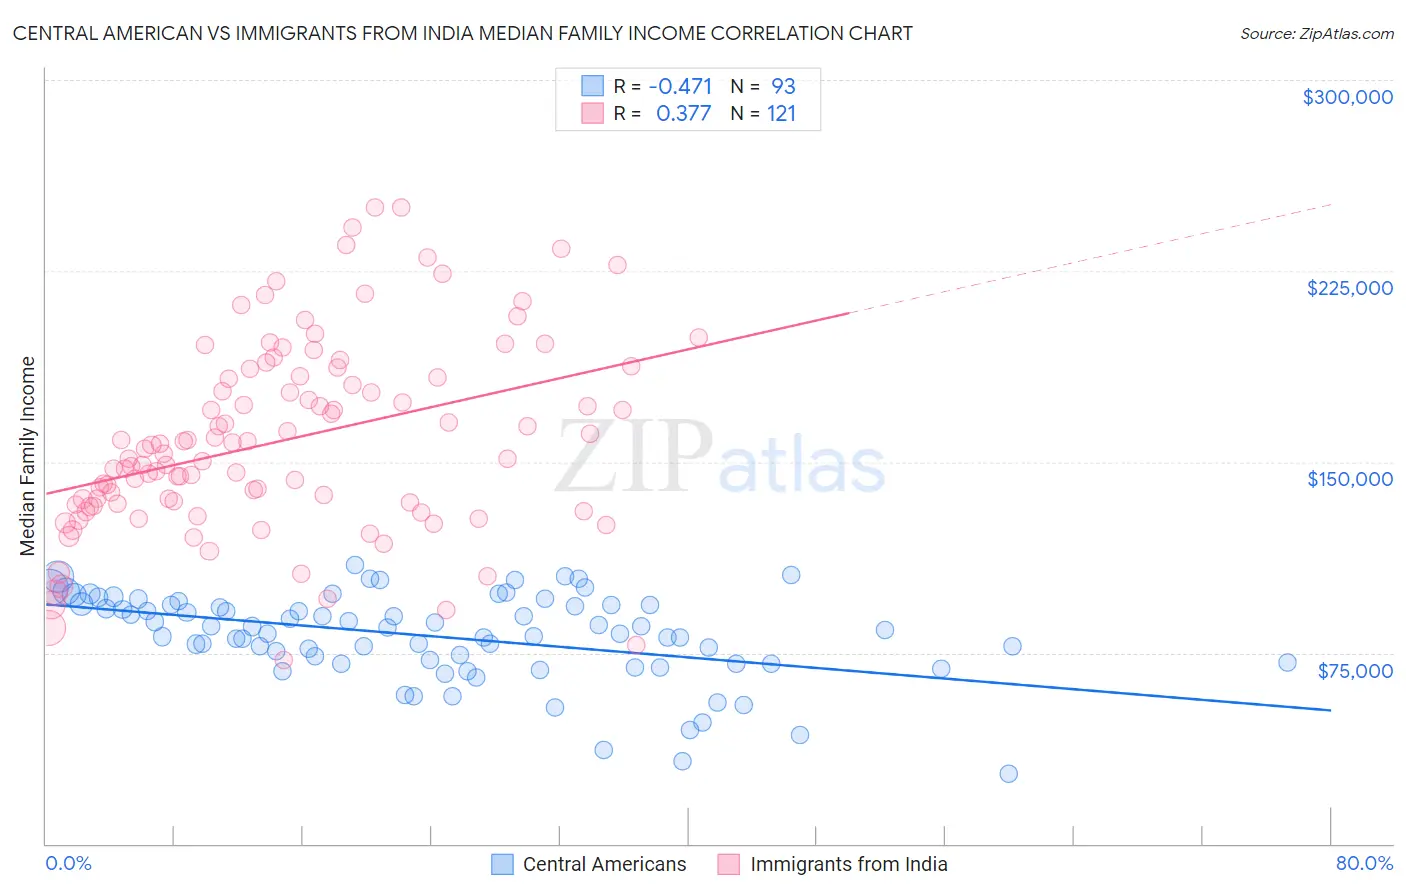
Central American vs Immigrants from India Median Family Income Correlation Chart
The statistical analysis conducted on geographies consisting of 503,776,524 people shows a moderate negative correlation between the proportion of Central Americans and median family income in the United States with a correlation coefficient (R) of -0.471 and weighted average of $91,087. Similarly, the statistical analysis conducted on geographies consisting of 433,562,423 people shows a mild positive correlation between the proportion of Immigrants from India and median family income in the United States with a correlation coefficient (R) of 0.377 and weighted average of $134,028, a difference of 47.1%.
Median Family Income Correlation Summary
| Measurement | Central American | Immigrants from India |
| Minimum | $27,406 | $71,983 |
| Maximum | $109,579 | $250,001 |
| Range | $82,173 | $178,018 |
| Mean | $81,381 | $158,155 |
| Median | $84,167 | $153,095 |
| Interquartile 25% (IQ1) | $70,836 | $132,876 |
| Interquartile 75% (IQ3) | $93,875 | $183,418 |
| Interquartile Range (IQR) | $23,039 | $50,542 |
| Standard Deviation (Sample) | $17,262 | $37,573 |
| Standard Deviation (Population) | $17,169 | $37,418 |
Similar Demographics by Median Family Income
Demographics Similar to Central Americans by Median Family Income
In terms of median family income, the demographic groups most similar to Central Americans are Mexican American Indian ($90,918, a difference of 0.19%), Hmong ($91,296, a difference of 0.23%), Cree ($90,882, a difference of 0.23%), Belizean ($90,880, a difference of 0.23%), and Senegalese ($91,475, a difference of 0.43%).
| Demographics | Rating | Rank | Median Family Income |
| Cape Verdeans | 0.4 /100 | #259 | Tragic $91,848 |
| Pennsylvania Germans | 0.4 /100 | #260 | Tragic $91,763 |
| Inupiat | 0.4 /100 | #261 | Tragic $91,730 |
| Liberians | 0.4 /100 | #262 | Tragic $91,722 |
| Immigrants | West Indies | 0.3 /100 | #263 | Tragic $91,588 |
| Senegalese | 0.3 /100 | #264 | Tragic $91,475 |
| Hmong | 0.3 /100 | #265 | Tragic $91,296 |
| Central Americans | 0.3 /100 | #266 | Tragic $91,087 |
| Mexican American Indians | 0.2 /100 | #267 | Tragic $90,918 |
| Cree | 0.2 /100 | #268 | Tragic $90,882 |
| Belizeans | 0.2 /100 | #269 | Tragic $90,880 |
| Jamaicans | 0.2 /100 | #270 | Tragic $90,581 |
| Iroquois | 0.2 /100 | #271 | Tragic $90,543 |
| Immigrants | Liberia | 0.2 /100 | #272 | Tragic $90,450 |
| Immigrants | Micronesia | 0.2 /100 | #273 | Tragic $90,345 |
Demographics Similar to Immigrants from India by Median Family Income
In terms of median family income, the demographic groups most similar to Immigrants from India are Iranian ($133,839, a difference of 0.14%), Immigrants from Singapore ($134,818, a difference of 0.59%), Thai ($131,281, a difference of 2.1%), Immigrants from Taiwan ($136,949, a difference of 2.2%), and Immigrants from Hong Kong ($131,067, a difference of 2.3%).
| Demographics | Rating | Rank | Median Family Income |
| Filipinos | 100.0 /100 | #1 | Exceptional $138,397 |
| Immigrants | Taiwan | 100.0 /100 | #2 | Exceptional $136,949 |
| Immigrants | Singapore | 100.0 /100 | #3 | Exceptional $134,818 |
| Immigrants | India | 100.0 /100 | #4 | Exceptional $134,028 |
| Iranians | 100.0 /100 | #5 | Exceptional $133,839 |
| Thais | 100.0 /100 | #6 | Exceptional $131,281 |
| Immigrants | Hong Kong | 100.0 /100 | #7 | Exceptional $131,067 |
| Immigrants | Iran | 100.0 /100 | #8 | Exceptional $130,894 |
| Okinawans | 100.0 /100 | #9 | Exceptional $129,979 |
| Immigrants | Ireland | 100.0 /100 | #10 | Exceptional $127,584 |
| Immigrants | Israel | 100.0 /100 | #11 | Exceptional $127,430 |
| Cypriots | 100.0 /100 | #12 | Exceptional $127,064 |
| Immigrants | Australia | 100.0 /100 | #13 | Exceptional $126,620 |
| Immigrants | South Central Asia | 100.0 /100 | #14 | Exceptional $125,956 |
| Eastern Europeans | 100.0 /100 | #15 | Exceptional $125,546 |