Central American vs French American Indian Disability Age 65 to 74
COMPARE
Central American
French American Indian
Disability Age 65 to 74
Disability Age 65 to 74 Comparison
Central Americans
French American Indians
25.1%
DISABILITY AGE 65 TO 74
0.5/ 100
METRIC RATING
255th/ 347
METRIC RANK
25.8%
DISABILITY AGE 65 TO 74
0.1/ 100
METRIC RATING
276th/ 347
METRIC RANK
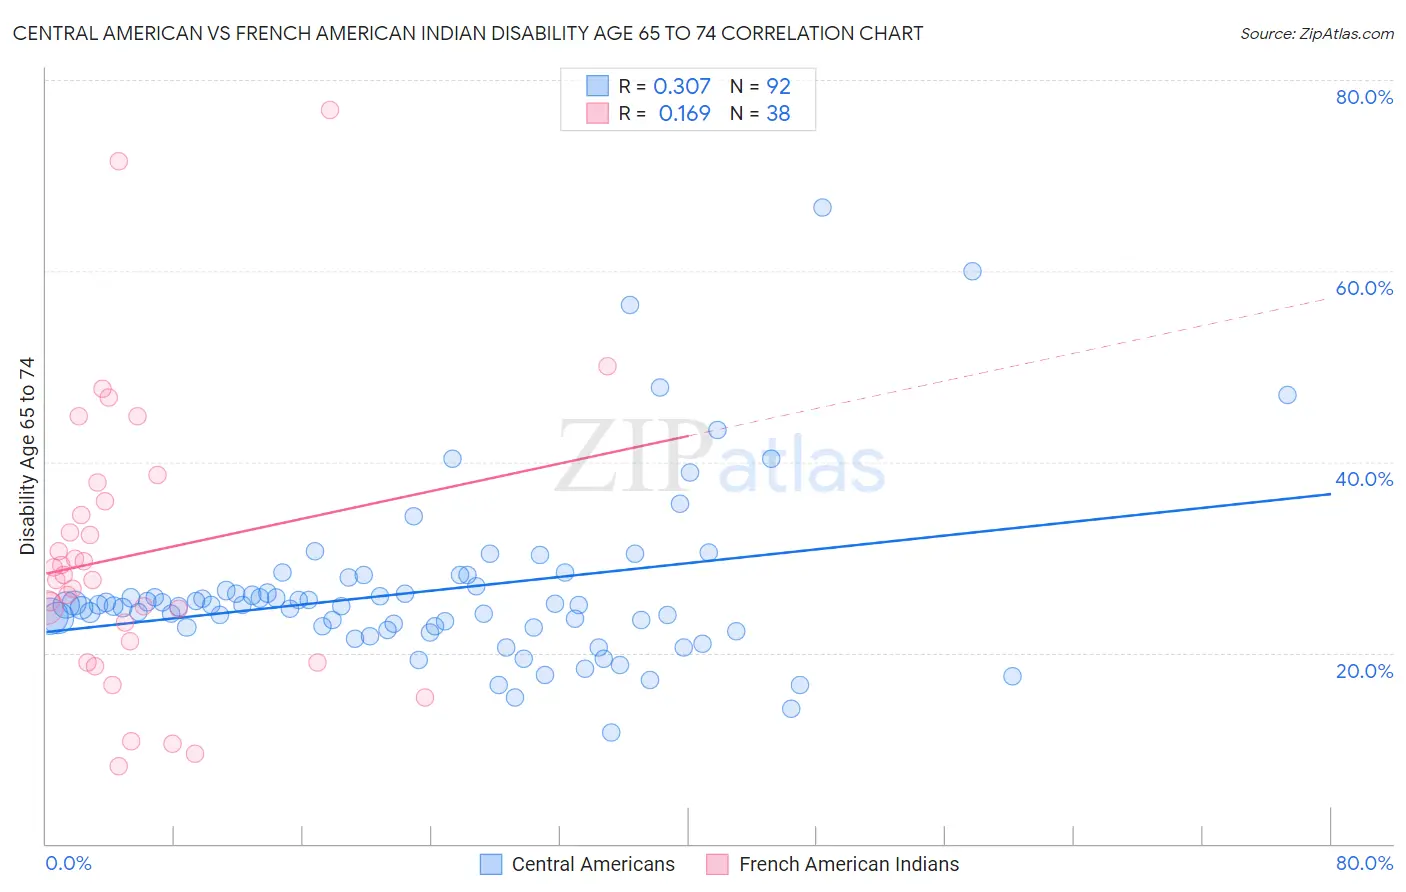
Central American vs French American Indian Disability Age 65 to 74 Correlation Chart
The statistical analysis conducted on geographies consisting of 503,060,028 people shows a mild positive correlation between the proportion of Central Americans and percentage of population with a disability between the ages 65 and 75 in the United States with a correlation coefficient (R) of 0.307 and weighted average of 25.1%. Similarly, the statistical analysis conducted on geographies consisting of 131,943,137 people shows a poor positive correlation between the proportion of French American Indians and percentage of population with a disability between the ages 65 and 75 in the United States with a correlation coefficient (R) of 0.169 and weighted average of 25.8%, a difference of 2.7%.
Disability Age 65 to 74 Correlation Summary
| Measurement | Central American | French American Indian |
| Minimum | 11.6% | 8.2% |
| Maximum | 66.7% | 76.9% |
| Range | 55.1% | 68.8% |
| Mean | 26.5% | 30.3% |
| Median | 25.0% | 27.9% |
| Interquartile 25% (IQ1) | 22.7% | 21.2% |
| Interquartile 75% (IQ3) | 26.8% | 35.9% |
| Interquartile Range (IQR) | 4.1% | 14.7% |
| Standard Deviation (Sample) | 8.9% | 14.9% |
| Standard Deviation (Population) | 8.9% | 14.7% |
Similar Demographics by Disability Age 65 to 74
Demographics Similar to Central Americans by Disability Age 65 to 74
In terms of disability age 65 to 74, the demographic groups most similar to Central Americans are Somali (25.1%, a difference of 0.16%), Subsaharan African (25.1%, a difference of 0.23%), Immigrants from El Salvador (25.1%, a difference of 0.27%), Immigrants from Somalia (25.2%, a difference of 0.41%), and Nonimmigrants (25.0%, a difference of 0.46%).
| Demographics | Rating | Rank | Disability Age 65 to 74 |
| Senegalese | 0.9 /100 | #248 | Tragic 24.9% |
| Immigrants | Fiji | 0.8 /100 | #249 | Tragic 25.0% |
| Salvadorans | 0.8 /100 | #250 | Tragic 25.0% |
| Immigrants | Nonimmigrants | 0.7 /100 | #251 | Tragic 25.0% |
| Immigrants | El Salvador | 0.6 /100 | #252 | Tragic 25.1% |
| Sub-Saharan Africans | 0.6 /100 | #253 | Tragic 25.1% |
| Somalis | 0.6 /100 | #254 | Tragic 25.1% |
| Central Americans | 0.5 /100 | #255 | Tragic 25.1% |
| Immigrants | Somalia | 0.4 /100 | #256 | Tragic 25.2% |
| Guamanians/Chamorros | 0.3 /100 | #257 | Tragic 25.3% |
| Marshallese | 0.3 /100 | #258 | Tragic 25.3% |
| Immigrants | Cambodia | 0.3 /100 | #259 | Tragic 25.3% |
| Malaysians | 0.2 /100 | #260 | Tragic 25.4% |
| Cape Verdeans | 0.2 /100 | #261 | Tragic 25.4% |
| Samoans | 0.2 /100 | #262 | Tragic 25.4% |
Demographics Similar to French American Indians by Disability Age 65 to 74
In terms of disability age 65 to 74, the demographic groups most similar to French American Indians are Honduran (25.8%, a difference of 0.010%), American (25.8%, a difference of 0.020%), Belizean (25.8%, a difference of 0.090%), Immigrants from Belize (25.8%, a difference of 0.11%), and U.S. Virgin Islander (25.9%, a difference of 0.19%).
| Demographics | Rating | Rank | Disability Age 65 to 74 |
| Hmong | 0.1 /100 | #269 | Tragic 25.7% |
| Immigrants | Guatemala | 0.1 /100 | #270 | Tragic 25.7% |
| Immigrants | Liberia | 0.1 /100 | #271 | Tragic 25.7% |
| Immigrants | Dominica | 0.1 /100 | #272 | Tragic 25.7% |
| Japanese | 0.1 /100 | #273 | Tragic 25.7% |
| Americans | 0.1 /100 | #274 | Tragic 25.8% |
| Hondurans | 0.1 /100 | #275 | Tragic 25.8% |
| French American Indians | 0.1 /100 | #276 | Tragic 25.8% |
| Belizeans | 0.1 /100 | #277 | Tragic 25.8% |
| Immigrants | Belize | 0.1 /100 | #278 | Tragic 25.8% |
| U.S. Virgin Islanders | 0.1 /100 | #279 | Tragic 25.9% |
| Cree | 0.1 /100 | #280 | Tragic 25.9% |
| Immigrants | Honduras | 0.1 /100 | #281 | Tragic 25.9% |
| Delaware | 0.1 /100 | #282 | Tragic 25.9% |
| Spanish Americans | 0.0 /100 | #283 | Tragic 25.9% |